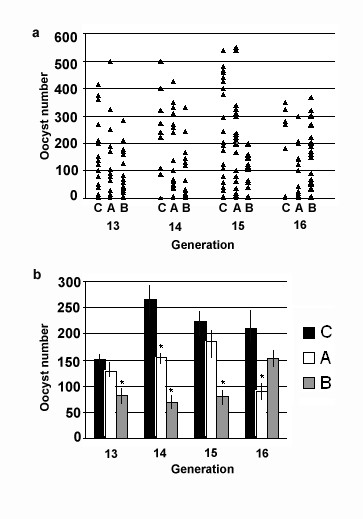
Figure 1.

Oocysts numbers in four different generations (13–16) of control (C) and exposed lines (A and B) of Anopheles gambiae after infection with Plasmodium berghei. a: Individual values (each dot represents the oocysts number in the midgut of each mosquito). b: Average and standard error of each group of individual values for generations 13–16. Asterisks indicate statistically significant differences (Mann-Whitney test) with respect to control values (*P < 0.05). (see Additional File 3 Table).
