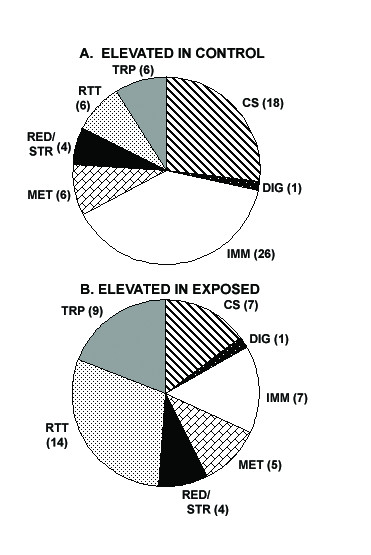
Figure 2.

Pie charts showing functional gene class distributions of differentially expressed genes between naïve non-blood fed mosquitoes of the exposed lines (generations 13 to 16) and the non-exposed control lines (generations 15 and 16). The genes are classified in seven different groups according to their predicted functions and shown in two subdivisions, (A) genes that have higher expression levels in the naïve non-blood fed non-exposed control lines and (B) genes that have consistent higher expression levels in the generations 13 to 16 of the exposed lines. [CS: cytoskeletal and structural genes, DIG: digestion-related genes, IMM: immune genes, MET: genes involved in metabolism, RED/STR: redox and stress-related genes, R/T/T: replication/transcription/translation related genes, TRP: transport-related genes]. (see Additional Files 4 and 5 tables).
