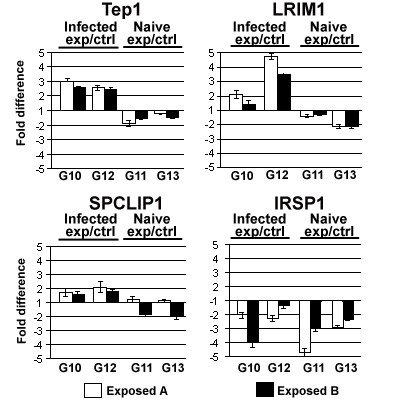
Figure 4.

Comparison of expression of the anti-Plasmodium immune genes TEP1, LRIM1, SPCLIP1, and IRSP1 between exposed and non-exposed lines upon P. berghei infection (Infected) (24 hours after feeding on P. berghei infected blood) and at a non-infected non-fed state (Naïve). Expression levels were determined by qRT-PCR in exposed lines A (open box) and B (black box) of generations 10 and 12 (G10 and G12) from infected mosquitoes and generations 11 and 13 (G11 and G13) for the non-infected naïve mosquitoes. The threshold values (Ct) of the four genes were normalized against the A. gambiae S7 gene, and the -fold differences in transcript abundance (exposed/non-exposed) were calculated for each gene in the exposed lines A and B with respect to the control line and plotted as bar diagrams. All qRT-PCRs were repeated at least three times, and the mean values are shown in the graph with standard errors indicated (see Additional File 7 Table).
