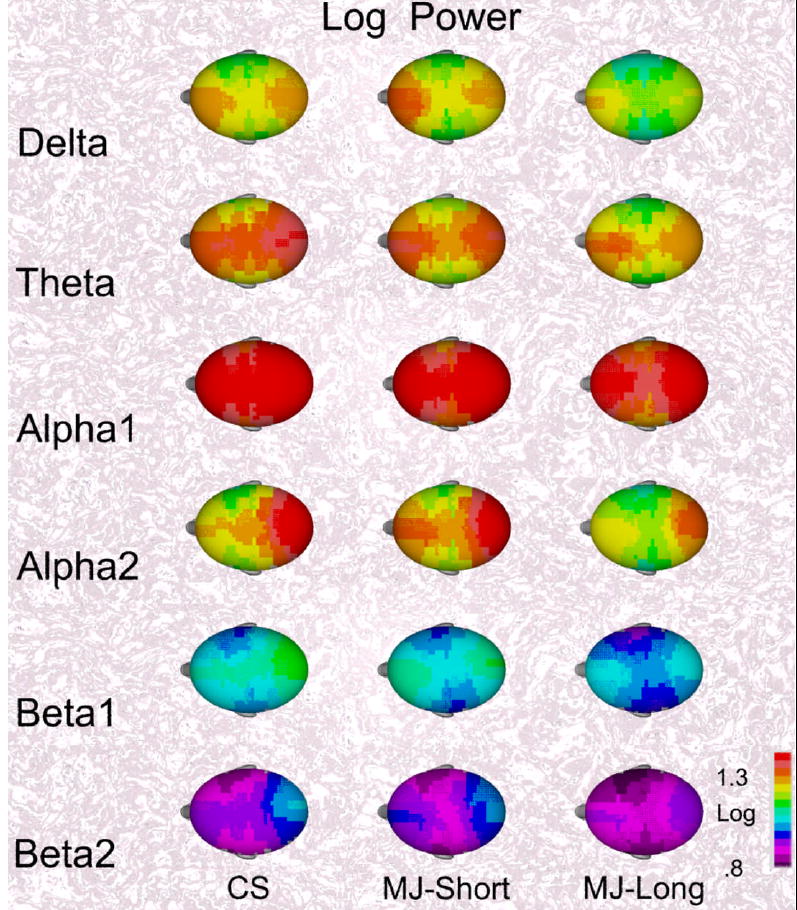
Figure 1.

The mean topographical maps of log power for the six EEG bands are shown for the three groups. The mean maps for the control subjects (CS) and marijuana subjects using for less than eight years (MJ-Short) appear similar while the maps of the marijuana subjects using more than eight years appear to have less EEG power.
