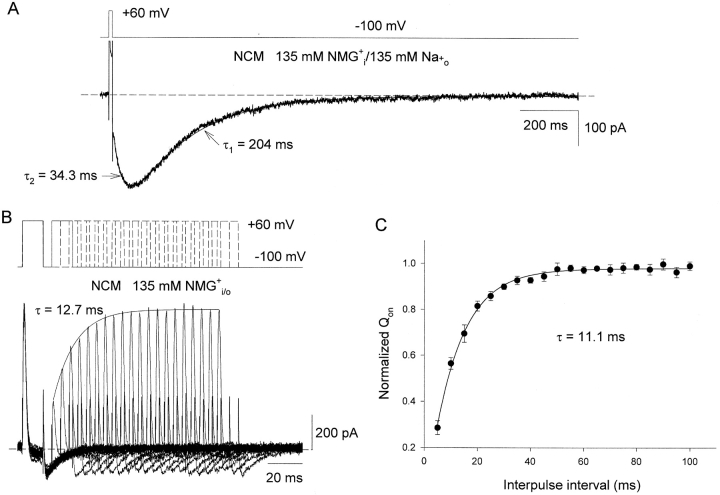
Figure 2.
Rates of pore closure and gating charge recovery in inactivated Kv1.5 NCM channels. (A) Na+ tail current through Kv1.5 NCM channels after a 12-ms depolarization. Voltage protocol is shown at the top. The current was recorded with 135 mM NMG+ i/135 mM Na+ o solutions. The decay of the tail current was fitted by single exponential function with a time constant (τ1) of 204 ms. The dotted line represents the zero current level. (B) Superimposed on- and off-gating current traces were elicited by a double pulse to 60 mV (top) separated by a variable interpulse interval from 5 to 100 ms with increments of 5 ms each cycle. The duration of both prepulse and the test pulse was 12 ms, and the interval between pairs of pulses was 2 s at −100 mV. Currents were recorded with symmetrical 135 mM NMG+ i / NMG+ o solutions. The solid line is the best fit to the peak of On-gating currents using a single exponential function with a time constant (τ) of 12.7 ms. The dotted line represents zero current level. (C) Fractional recovery of Qon after a 12-ms prepulse. Qon was obtained by integrating on-gating currents during 12-ms pulses, normalized to that during the prepulse, and plotted as a function of interpulse interval. Data points represent means ± SEM from 10 cells. Solid line is the best fit to data points using single exponential function with a time constant (τ) of 11.1 ± 0.4 ms.

