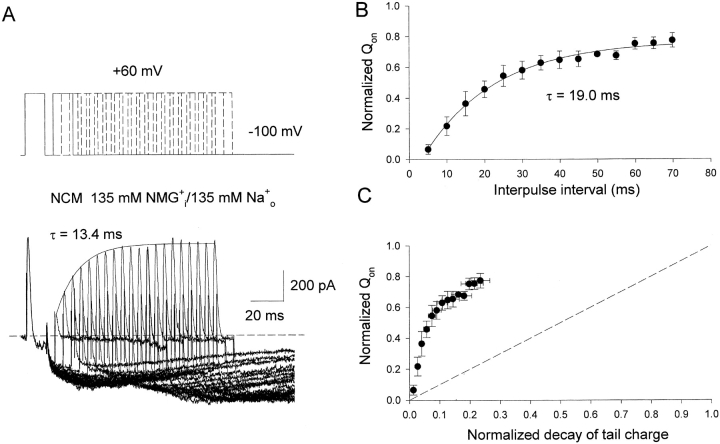
Figure 3.
Effects of 135 mM Na+ o on the relation between charge recovery and pore closure in inactivated Kv1.5 NCM channels. (A) Top, double-pulse protocol includes two identical 12-ms pulses to 60 mV separated by a variable interpulse interval from 5 to 100ms with increments of 5 ms. Cells were held at −100 mV for 2 s between pairs of pulses. Bottom, superimposed whole cell current traces elicited by the protocol shown at the top. Currents were recorded with 135 mM NMG+ i/135 mM Na+ o solutions to record on-gating currents and inward Na+ tail currents at −100 mV. Solid line is the single exponential fitting to the peak of on-gating currents (τ = 13.4 ms). The dotted line represents the zero current level. (B) Fractional recovery of Qon (Qon test/Qon prepulse) plotted as a function of interpulse interval. Data points represent means ± SEM from four cells, and the solid line is the best fit to data points using a single exponential function with τ = 19.0 ± 1.6 ms. (C) Fractional recovery of Qon is plotted as a function of the loss of Na+ tail charge. The Na+ tail charge was obtained by integration of Na+ tail currents shown in Fig. 2 A. Data points represent means ± SEM from 4–5 cells. Dotted line represents a linear relationship between the charge recovery and the channel closure, with a slope of 1.0.

