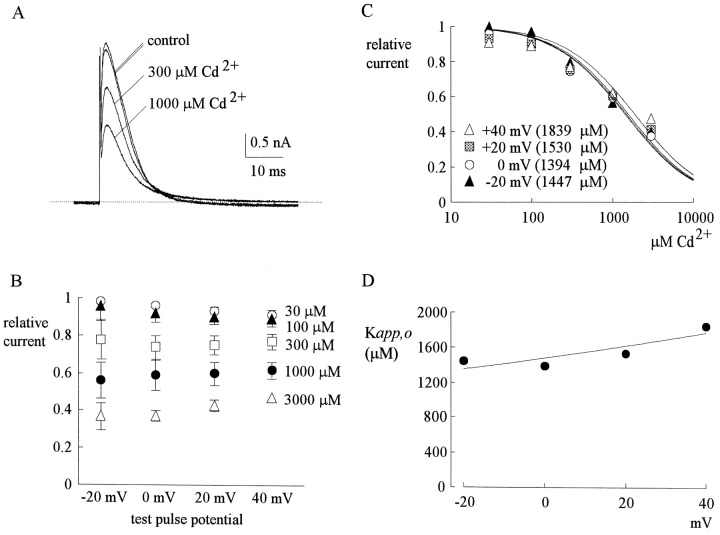
Figure 1.
Outward TTX-R Na+ currents inhibited by external Cd2+. (A) The cell was held at −130 mV and stepped every 4 s to the test pulse (0 mV) for 60 ms. With 150 mM Na+ internal solution and 150 mM Cs+ external solution, outward TTX-R Na+ currents were elicited by depolarization to 0 mV and were inhibited by 300 and 1,000 μM Cd2+. The two control sweeps were obtained before and after Cd2+ inhibition, demonstrating rapid reversibility of the inhibition. The dotted line indicates the zero current level. (B) Inhibition of outward TTX-R Na+ currents by different concentrations (30–3,000 μM, as indicated beside each series of symbols) of Cd2+ at different test pulse voltages. The experimental conditions and pulse protocols were generally similar to that described in A, except that the test pulse was varied from −20 to 40 mV in 20-mV steps (the horizontal axis). The relative current (the vertical axis) at each test pulse potential is defined by normalization of the peak currents in the presence of Cd2+ to the peak current in the control (Cd2+-free) solution (n = 3–9). The inhibition is clearly Cd2+ concentration dependent, yet shows only minimal voltage dependence. (C) The mean relative current in B is plotted against [Cd2+] (the concentration of Cd2+) in semilogarithmic scale. The lines are best fits for each set of data points of the form: relative current = 1/{1 + ([Cd2+]/K app,o)}, where K app,o stands for the apparent dissociation constant of Cd2+ in such an experimental configuration (150 mM Cs+ outside and outward Na+ current). The K app,o from the fits are given in the parentheses in the figure. (D) The K app,o obtained in C are plotted against test pulse voltage in semilogarithmic scale. The line is the best fit to the data points of the form: K app,o = 1480 μM * exp(V/230), where V stands for the test pulse voltage in mV.

