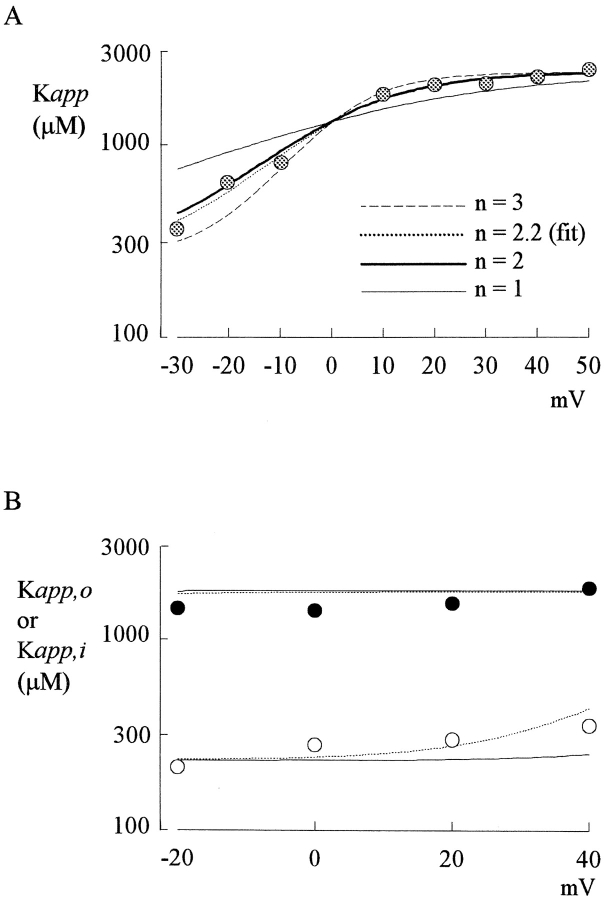
Figure 8.
Analysis of the experimental data with flux-coupling equations. (A) The data in Fig. 4 C are analyzed with Eq. 5 (see text). The thick dotted line is the best fit to the data of the form: K app = 2,400 μM * {exp(2.2V/25)/[1+exp(2.2V/25)]} + 260 μM * [1/exp(2.2V/25)], where V stands for the test pulse voltage in mV. The thin solid, thick solid, and thin dashed lines are curves with n values equal to 1, 2, and 3, respectively. It is evident that n = 1 describes the data much more poorly than n = 2 or 3. Because of limitation of the data range (the values below −30 mV cannot be reliably measured; Fig. 4B) and the simplifications made in the derivation of Eq. 5 (e.g., neglect of the small intrinsic voltage dependence of Cd2+ block), we do not mean to have an exact n, Do, and Di values from the fit. Instead, the major purpose is to show that the data described previously by two discontinuous functions considering only direct effect of the membrane electrical field on the blocking Cd2+ ion can actually be well described by one single equation based on the flux-coupling concepts. Also, it seems safe to say that more than 1, or at least 2, Na+ ions coexist with the blocking Cd2+ ion in this single-file region of the pore. (B) The same data points in Figs. 1 D (K app,o) and 2 D (K app,i) are put in the same plot and are described by an equation modified from Eqs. 1 and 5: D (K app,o or K app,i) = {R*exp(2V/25)/[1+R*exp(2V/25)]}*Do + {1/[1+R*exp(2V/25)]}*Di, where R equals to the square of the permeability ratio between Na+ and Cs+ (or between Cs+ and Na+, determined by the experimental configuration). For external Cs+ and internal Na+ (black symbols, the K app,o in Fig. 1 D), the R values are either 2,000 (solid line) or 200 (dashed line), and the Do and Di values are 1,800 and 200 μM, respectively. For internal Cs+ and external Na+ (white symbols, the K app,i in Fig. 2 D), as a first approximation R becomes inverses of the previous values and are either 0.0005 (solid line) or 0.005 (dashed line), whereas the Do and Di values are 2,100 and 230 μM, respectively. These Do and Di values are arbitrarily assigned to fit the data, because the apparent voltage dependence of the data points is simply too shallow to allow any purposeful fits. The slightly smaller Do and Di values than those in A probably partly reflecting the slightly enhanced Cd2+ binding rate because of the even weaker competition for the binding site by Cs+ than by Na+. The ∼9-fold difference between Do and Di, however, is deliberately kept unchanged. It is evident from the plot that the most important results from A (an ∼9-fold larger Do than Di, and an n value of ∼2–3) could also successfully describe the data in Figs. 1 and 2 over a wide range of permeability ratio between Na+ and Cs+.

