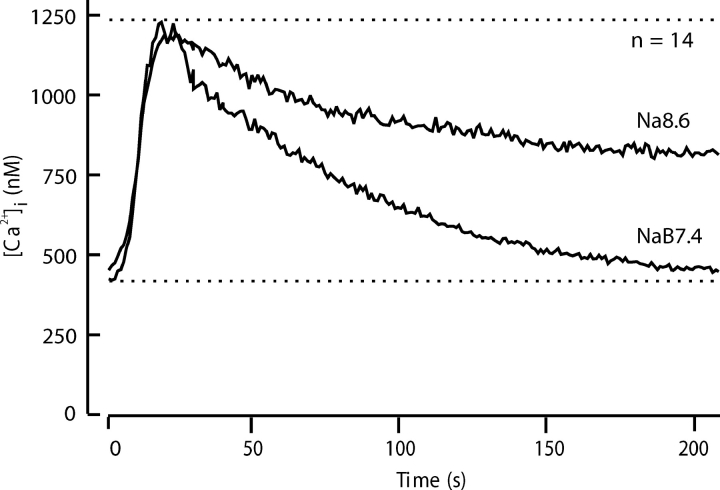
Figure 3.
Comparison of calcium clearance with and without slowing of the plasma membrane Ca2+ -ATPase by alkaline pHo. Recovery was monitored in 14 experiments with different cells using the five-stimulus protocol of Fig. 2. The records for the third (NaB7.4) and fourth (Na8.6) cycles of stimulus and recovery were aligned and averaged.

