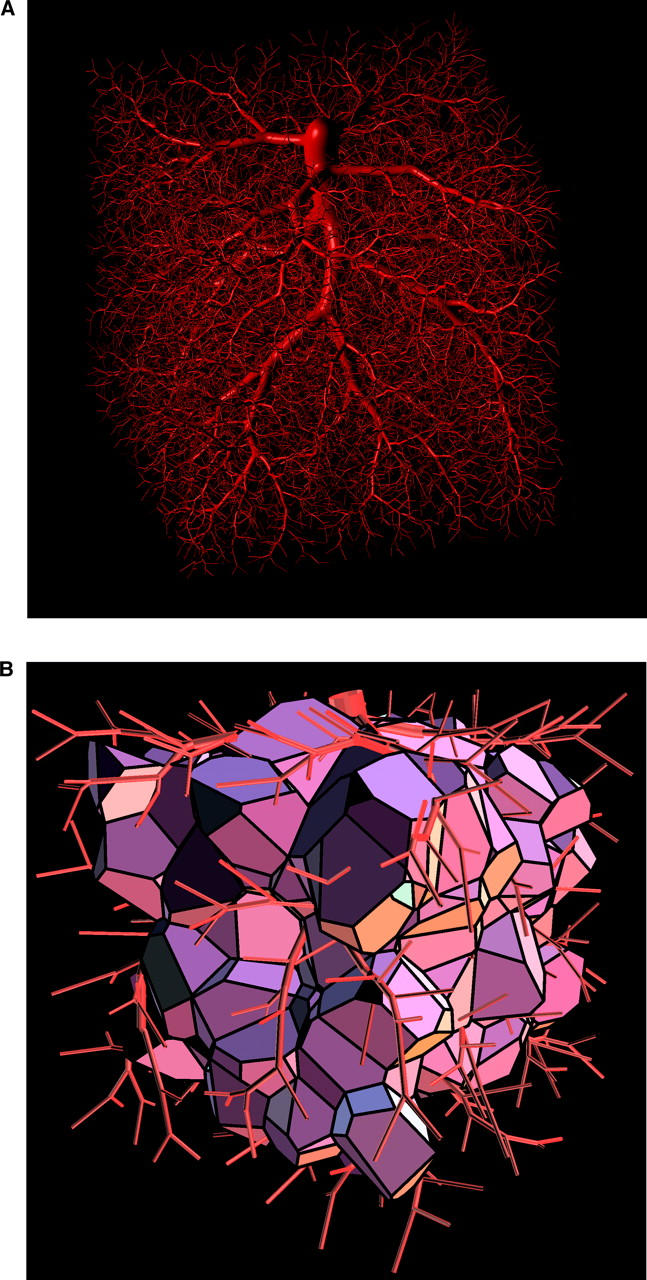
Figure 2.

Visual representation of a model tree and corresponding Voronoi polyhedra. (A) CCO tree with N term = 16,000 terminal segments optimized for minimum intravascular volume. Simulation parameters are listed in Table I. Visualization was performed by representing the vessel segments as the isosurface of a pseudopotential assigned to the whole tree (see Neumann et al., 1996). (B) Voronoi polyhedra of the tree in panel (A) with N term = 400 (boundary polyhedra excluded). The visual representation was generated by means of the Geomview program (designed by S. Levy, T. Munzer, M. Phillips, C. Fowler, N. Thurston, D. Krech, S. Wisdom, D. Meyer, and T. Rowley, University of Minnesota, MN).
