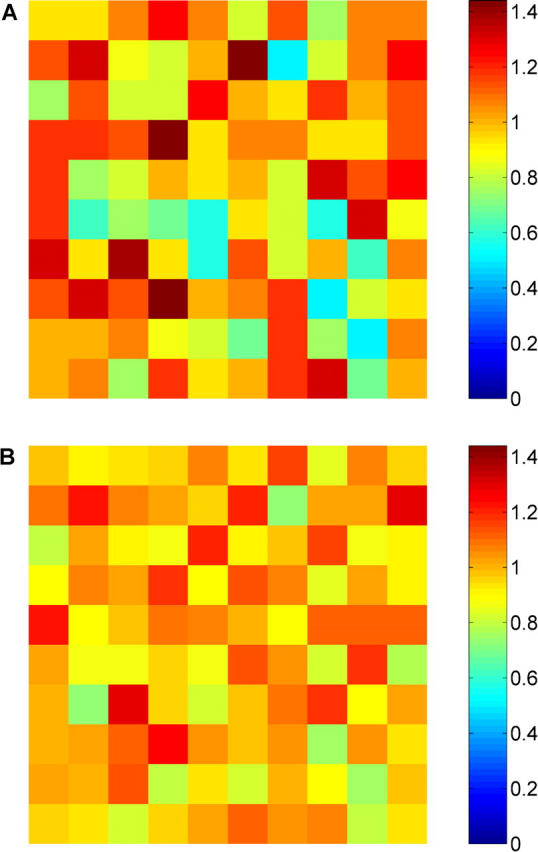
Figure 4.

Spatial distribution of relative regional flows, q* = q/<q>, for a resolution of 10 × 10 × 10 volume elements of size v = 0.1 ml. Flow magnitudes are color coded as indicated in the side-bar. Samples were taken from the central slice of the cubic perfusion volume of specific realizations of model 1 (A) and model 2 (B). The different patterns illustrate that the clustering of high- and low-flow regions is less pronounced for model 2 than for model 1, i.e., terminal flows scaled by associated Voronoi polyhedra volumes (model 2) render regional flows more homogeneous than equal terminal flows (model 1).
