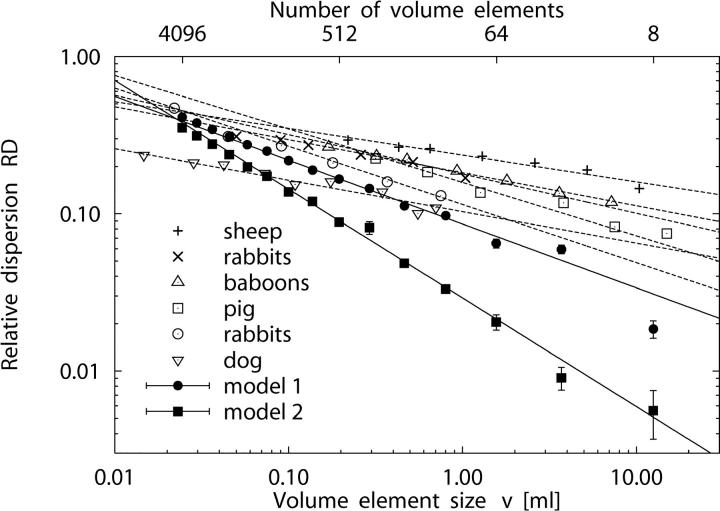
Figure 5.
Fractal scaling of perfusion heterogeneity. Log-log plot of relative dispersion RD (mean ± SD) of regional flows vs. volume element size v for 5 realizations of model 1 (•), fractal dimension D = 1.405 ± 0.009, and model 2 (▪), D = 1.691 ± 0.016. The number of volume elements corresponding to v is given at the top of the plot. The other symbols indicate experimental data of the myocardium: Sheep (+) with D = 1.17 ± 0.07, n = 11; rabbits (×) with D = 1.25 ± 0.07, n = 7; baboons (▵) with D = 1.21 ± 0.04, n = 10 (Bassingthwaighte et al., 1989). Pig (□) from Exp. 3 of the normal saline (NS) group (D = 1.34 ± 0.04, n = 7) of Kleen et al., 1997. Rabbits (○) with D = 1.37 ± 0.06, n = 46 (Iversen and Nicolaysen, 1995). Dog #4 (▿) of the control group of Mori et al., 1995 (D = 1.21 ± 0.08, n = 4). Straight solid and dashed lines are linear least-squares fits to data points.

