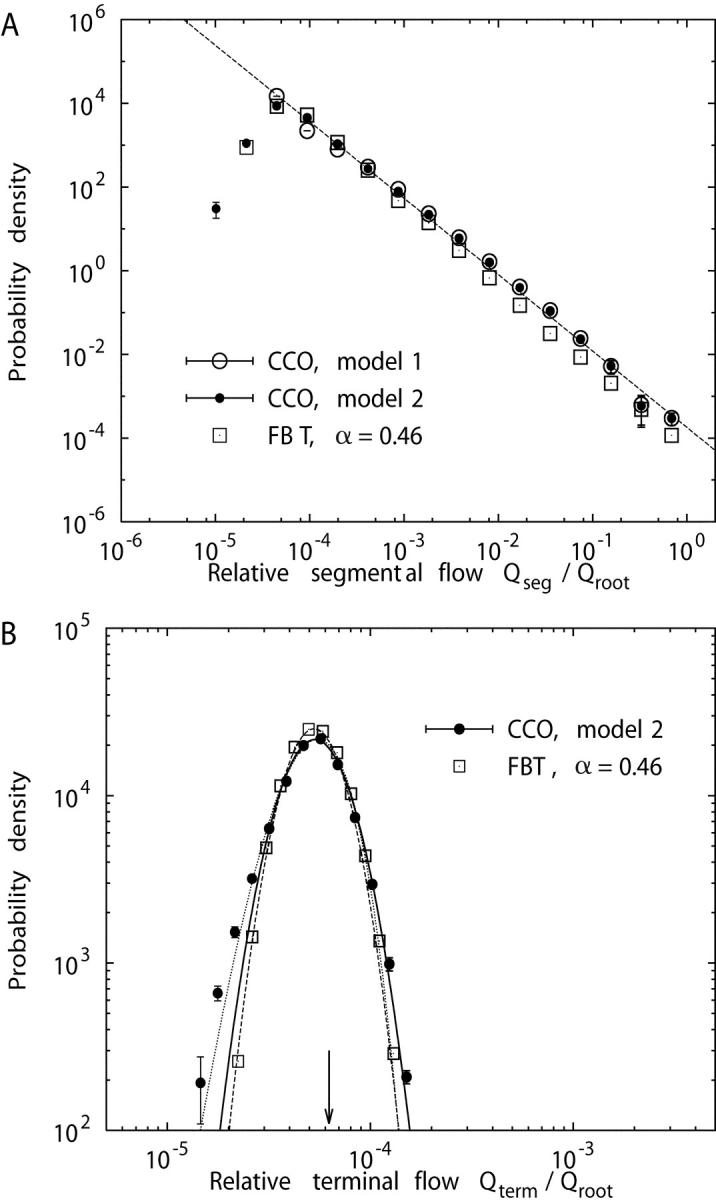
Figure 7.

Log-log plot of the probability density functions p(x) of relative segmental flows (mean ± SD, n = 5 simulations), normalized by the flow through the root segment, for model 1 (○), model 2 (•), and the fractal branching tree (FBT) model (□) of Van Beek et al. (1989) with n = 14 generations and flow-asymmetry parameter α = 0.46. (A) All segments included, the dashed line indicates a least-squares fit to the data points of model 1 and represents a power-law relation, p(x) ∼ x −β with β = 1.83 ± 0.03. (B) Terminal segments only, together with least-squares fits of lognormal distributions, Eq. 12, to model 2 (solid line) and to the FBT-model (dashed line). The dotted line is a least-squares fit of a two-parameter gamma distribution, Eq. 13, to model 2. The arrow marks the value of relative terminal flows in model 1, Q term/Q root = 1/16,000 = 6.25 × 10⁻⁵.
