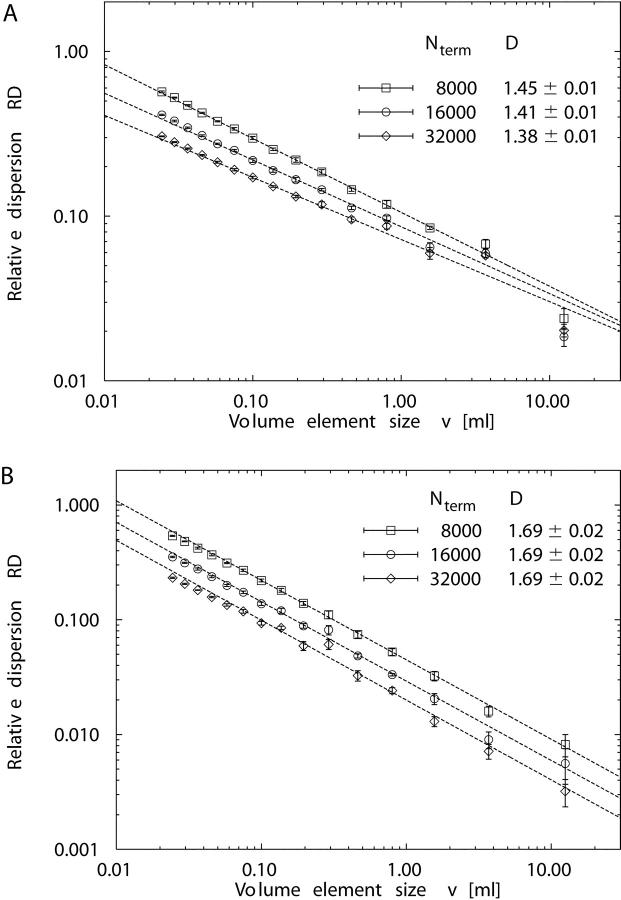
Figure 8.
Dependence of the relative dispersion RD (mean ± SD, n = 5 simulations) and fractal dimension D of perfusion heterogeneity on the number N term of terminal segments for model 1 (A), model 2 (B), and for N term = 8,000 (□), N term = 16000 (○), and N term = 32,000 (⋄). In both models, the absolute values of RD systematically decrease with increasing N term. Although D of model 2 is practically insensitive to N term, model 1 exhibits a gradual decrease of D with increasing N term.

