Figure 5.
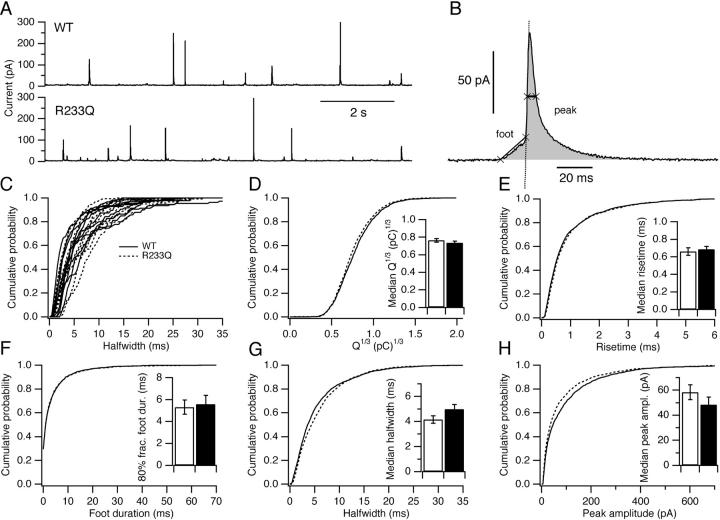
Single event characteristics are unchanged in R233Q cells. (A) Amperometric current recordings from a WT and a R233Q cell. (B) Extraction of single event characteristics: A semiautomatic routine detected the spikes, performed baseline subtraction, identified the halfwidth (thick line with two crosses across the peak), the risetime, peak amplitude, duration of the foot signal (line with two crosses connects the beginning and end of the foot signal), and integrated the spike (gray area) to derive the charge. (C) Cell-distributions of halfwidths for 10 randomly selected WT cells (full lines) and 10 randomly selected R233Q cells (dashed lines). Note the large cell-to-cell variations in the position of the distribution. (D) Averaged cumulative distribution of cubic-root of the charge for WT cells (full lines), and R233Q cells (dashed lines). (Inset) Mean ± SEM of median Q1/3 for WT and R233Q cells. (E) Averaged cumulative distribution of 50–90% risetime. (Inset) Median risetime. (F) Averaged cumulative distribution of foot duration. (Inset) 80% fractile foot duration. (G) Averaged cumulative distribution of halfwidth. (Inset) Median halfwidth. (H) Averaged cumulative distribution of peak amplitude. (Inset) Median peak amplitude. A total of 2,436 spikes from 22 WT cells (41–236 spikes pr cell) and 2,086 spikes from 22 R233Q cells (19–165 spikes per cell) were analyzed.

