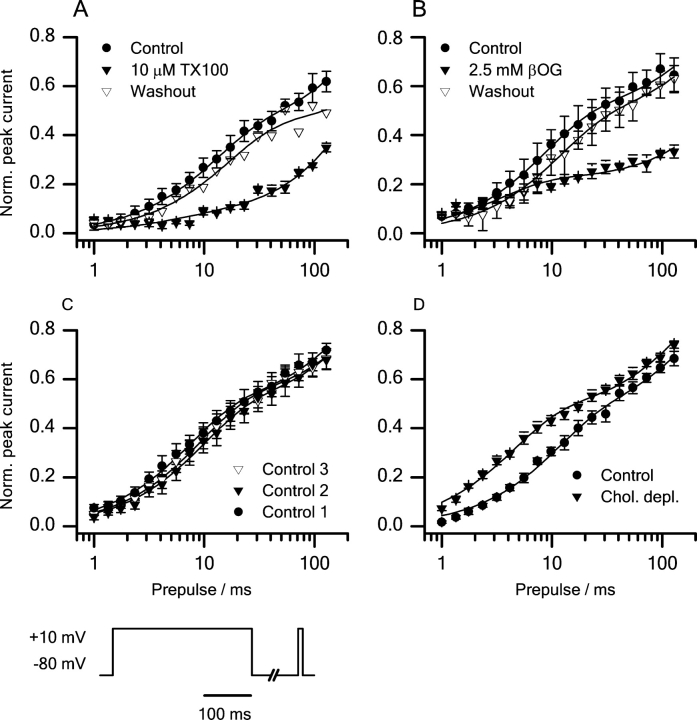
Figure 10.
Time course of recovery from inactivation. (A) (•) Control; (▾) 10 μM TX100; (▿) washout. (B) (•) Control; (▾) 2.5 mM βOG; (▿) washout. (C) Timed control experiments. (•) Control 1; (▾) control 2; (▿) control 3. (D) (•) Control; (▾) cholesterol depleted. Pulse protocol: every 5 s the cells were depolarized from −80 to +10 mV for 300 ms, followed by a repolarization to −80 mV for time intervals varying from 1 to 128 ms; finally the channel availability was determined at +10 mV. Mean ± SEM (n = 3, 3, 6, 6, and 5: TX100, βOG, timed controls, cholesterol-depleted, timed controls for cholesterol experiments).

