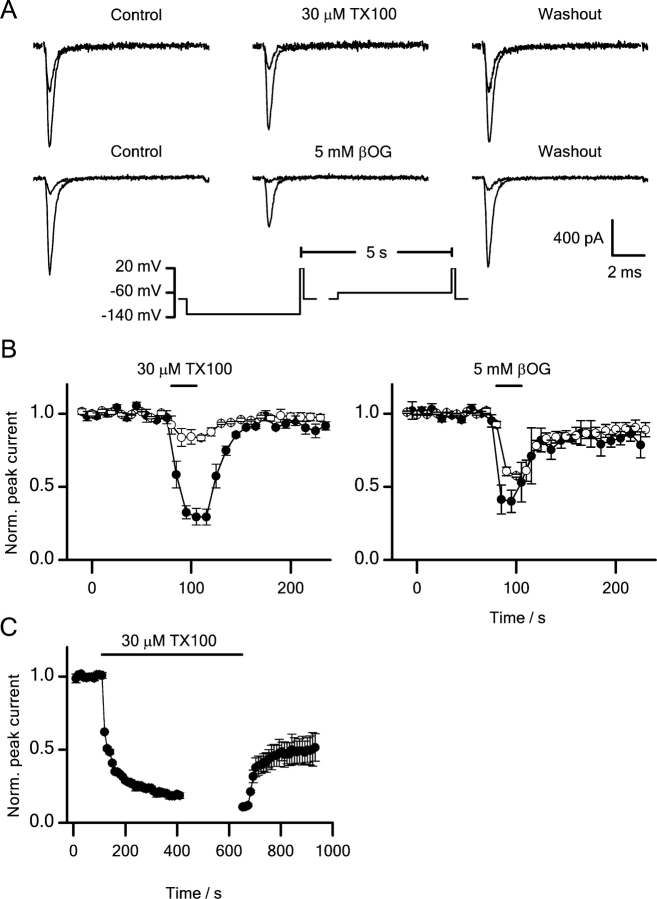
Figure 3.
Effects of βOG and TX100 on sodium channels. (A) Current traces showing the reversible inhibition of sodium currents by βOG and TX100. (B) The time course of peak current inhibition during and after a 25-s application of 30 μM TX100 or 5 mM βOG. Pulse protocol: every 5 s the cells were depolarized to +20 mV from a 300 ms prepulse to either −60 mV (•) or −130 mV (○). Holding potential −80 mV. The horizontal bar denotes the time period of application. Mean ± SEM (n = 3, 4, TX100, βOG). (C) Time course of peak current inhibition during 9-min application of 30 μM TX100 followed by a 5-min washout period (mean ± range, n = 2). Horizontal bars denote time periods of application and washout, respectively.

