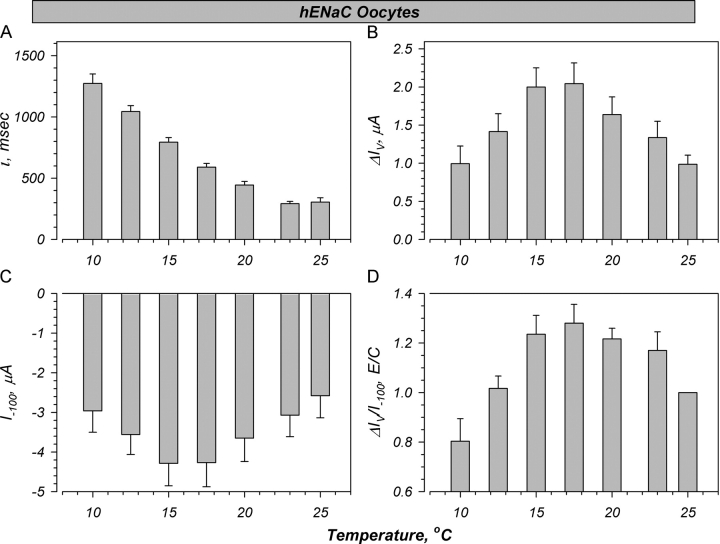
Figure 6.
Summary of effects of temperature on voltage activation. Experiments were performed in oocytes bathed in ND94. (A) A large increase of t is observed with decreasing temperature leading to ∼5-fold increase at 10°C. (B) A biphasic stimulation of the magnitude of voltage activation (ΔIV) is observed with a Tmax in the range of that calculated for g Na (see Fig. 2). (C) A similar biphasic stimulation is also observed with the initial current at −100 mV (I−100), and (D) with the ratio of ΔIV to I−100. Values at 4°C were eliminated as the time constants were >1,500 ms and could not be accurately fit from the acquired data points. n = 7.

