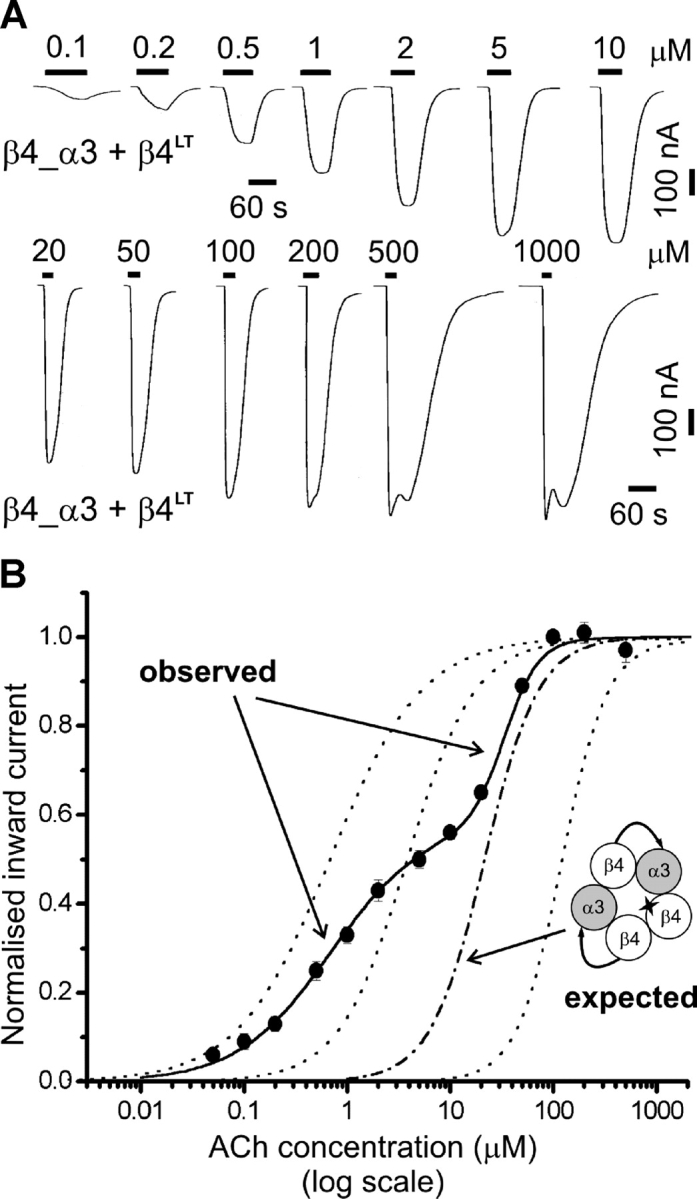
Figure 7.

Inserting the L9′T reporter mutation in the β4monomer subunit of linked subunit nAChRs reveals multiple receptor populations. (A) Examples of inward currents elicited by bath-applied ACh in oocytes expressing β4_α3 + β4LT. (B) Concentration-response curve for oocytes injected with β4_α3 + β4LT cRNAs (filled circles, n = 4). Data were normalized and pooled as described in materials and methods and in the legend to Fig. 2. In this case the initial fit was a simultaneous fit of a two-component Hill equation to each dose–response curve, with the constraint of equal EC 50 and Hill slope across oocytes (the proportion of the first component was allowed to vary). The three dotted curves shown for reference are, respectively (right to left), the concentration-response curve for receptors with no mutations (β4_α3 + β4), two mutation copies (β4_α3LT + β4), or three mutation copies (β4LT_α3 + β4LT). The dashed curve shows the concentration-response curve expected for complete tandem incorporation as depicted in the cartoon (i.e., one mutation copy).
