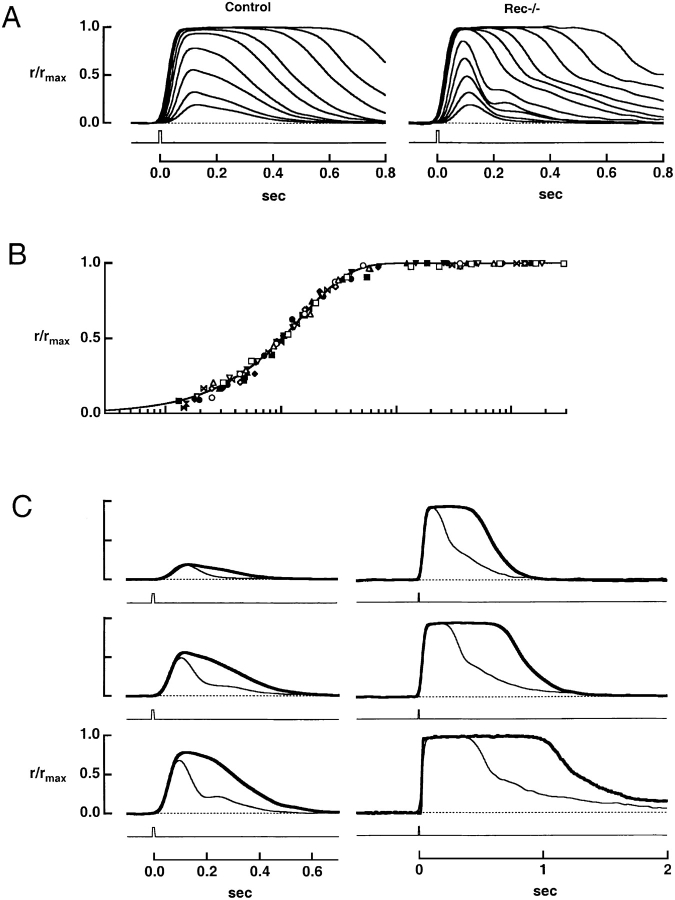
Figure 2.
The effect of recoverin deletion on flash responses. (A) Averaged responses of a control rod and a rec−/− rod to flashes of increasing strength. The maximal response amplitudes were 16.4 and 12.9 pA for control and rec−/− rods, respectively. Flash strengths for the control rod were: 11.8, 20.6, 42.8, 74.9, 139, 243, 504, 882, and 1,690 photons μm−2, while for the rec−/− rod, they were 12.8, 22.4, 46.5, 81.4, 151, 548, 960, 1,840, 3,230, 6,700, and 11,700 photons μm−2. (B) Stimulus-response relation for seven control (filled symbols) and seven rec−/− rods (open symbols). The continuous line is a saturating exponential, r/rmax= 1 − exp(−ki/i1/2), where rmax is the saturating response amplitude, k = ln(2), i is the flash strength, and i1/2 is the flash strength producing a half-maximal response for each cell. The cells in A are shown by the (▾, control), and by the (□, knockout). (C) Faster flash response recovery in a rec−/− rod. Each pair of traces shows the averaged responses elicited by flashes of similar strength from the control (thick trace) and rec−/− (thin trace) rods in A. The flash strengths were (top to bottom, left to right): 11.8, 42.8, 74.9, 504, 1,690, and 6,160 photons μm−2 for the control rod and 12.8, 46.5, 81.4, 548, 1,840, and 6,700 photons μm−2 for the rec−/− rod.

