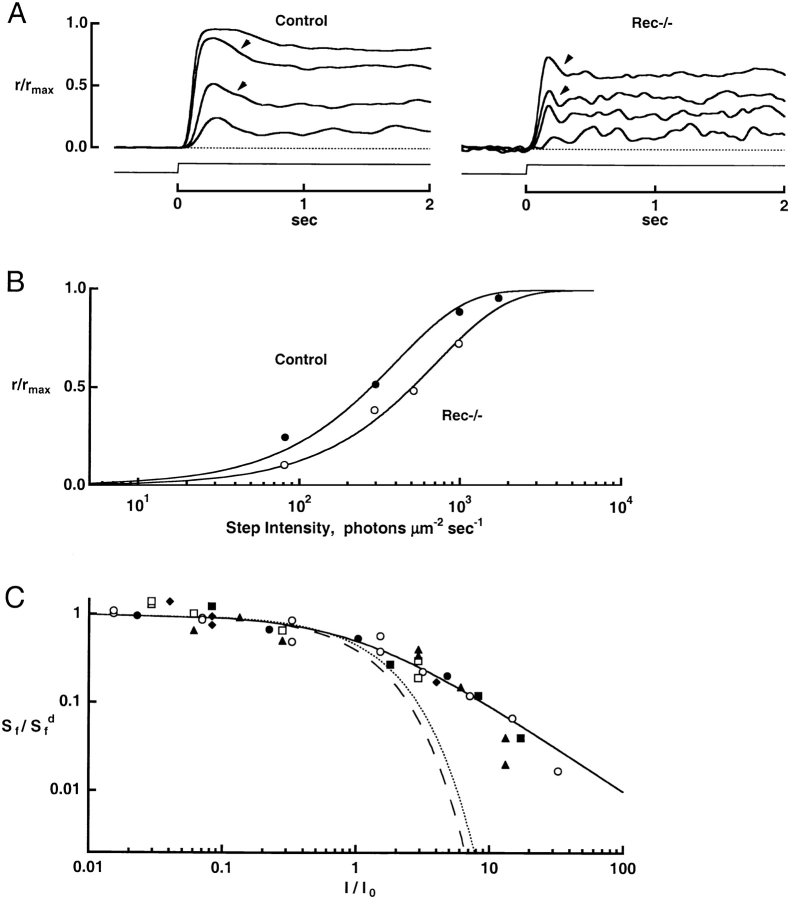
Figure 7.
Responses to steps of light and to flashes superimposed on steps. (A) Averaged responses of a control rod and a rec−/− rod to steps of light. Arrowheads mark the partial recovery in current resulting from light adaptation. Maximal response amplitudes were 14.5 and 8.0 pA for control and rec−/− rods, respectively. (B) Diminished sensitivity of a rec−/− rod to steps of light. Results from A were fitted with a saturating exponential function (continuous lines). Half-maximal responses were elicited with intensities of 273 and 495 photons μm−2 s−1 at 500 nm in the control and rec−/− rods, respectively. (C) Normal incremental flash sensitivity in rec−/− rods. Rods were adapted to a background light for a minimum of 40 s and then probed with dim test flashes. Dim flashes were also given in darkness before and after presentation of the background to monitor the condition of the cells. The continuous line plots the Weber-Fechner relation (Eq. 1). For comparison, the dashed and dotted lines plot the behaviors predicted by saturation alone (Eq. 2) for control and rec−/− rods, respectively. Collected results from four control (filled symbols) and two rec−/− rods (open symbols).

