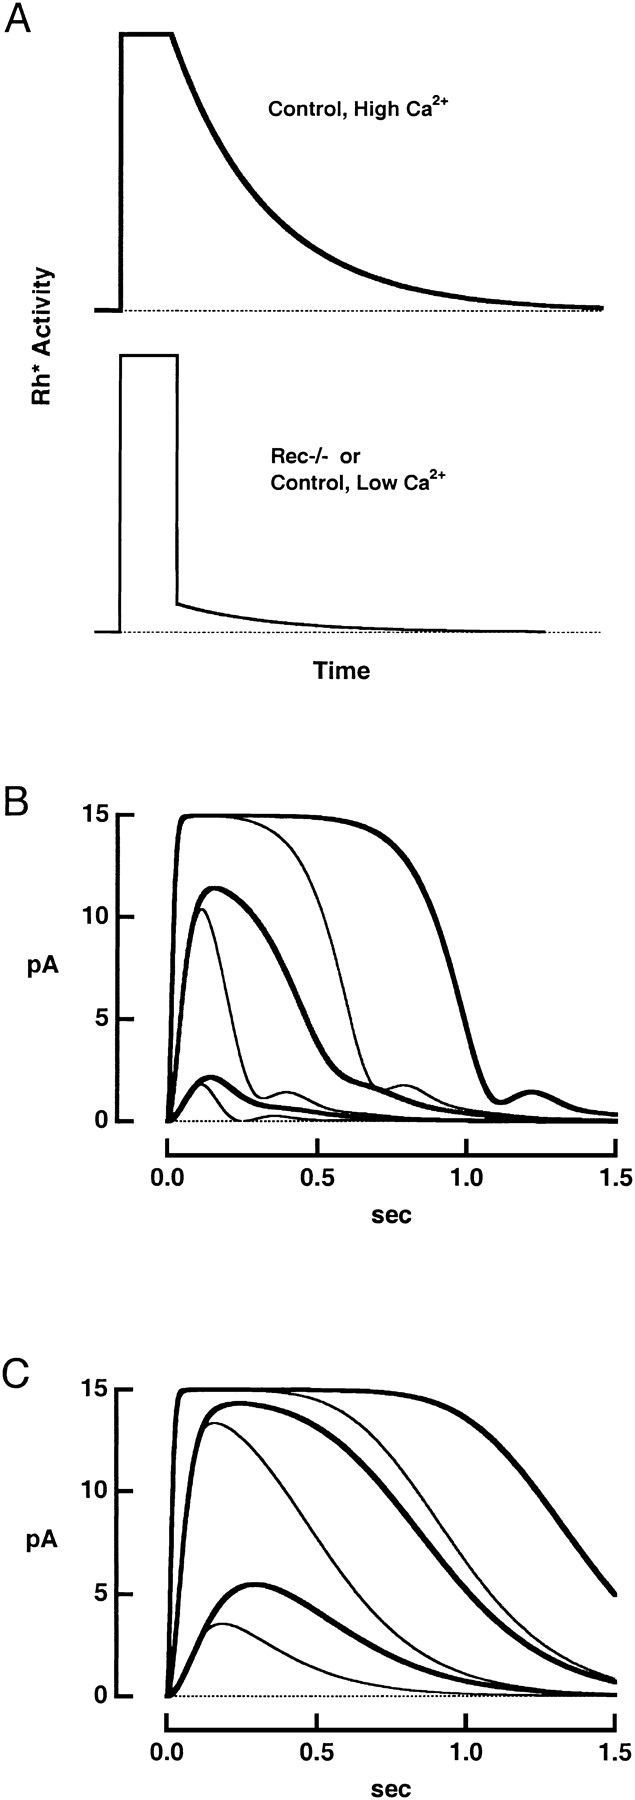
Figure 8.

Calculated flash responses. (A) Assumed time courses of rhodopsin's catalytic activity. In the control rod (top), activity shut off exponentially after a delay of 100 ms (Chen et al., 1995b, 1999). The time constant of 205 ms was found from the mean slope of the relation between Tsat and the natural logarithm of the flash strength (compare Pepperberg et al., 1992). In the rec−/− rod (bottom), rhodopsin activity suddenly fell ninefold after 100 ms and then decayed exponentially with a time constant of 205 ms. (B) Photocurrents generated by the flash response model () for control (thick traces) and rec−/− (thin traces) rods. Rhodopsin's catalytic activity was increased ten-fold for successive pairs of responses. (C) Responses from the model in the absence of Ca2+ feedback onto guanylate cyclase for rods with (thick traces) and without (thin traces) recoverin. The catalytic activity levels of rhodopsin are the same as those in B.
