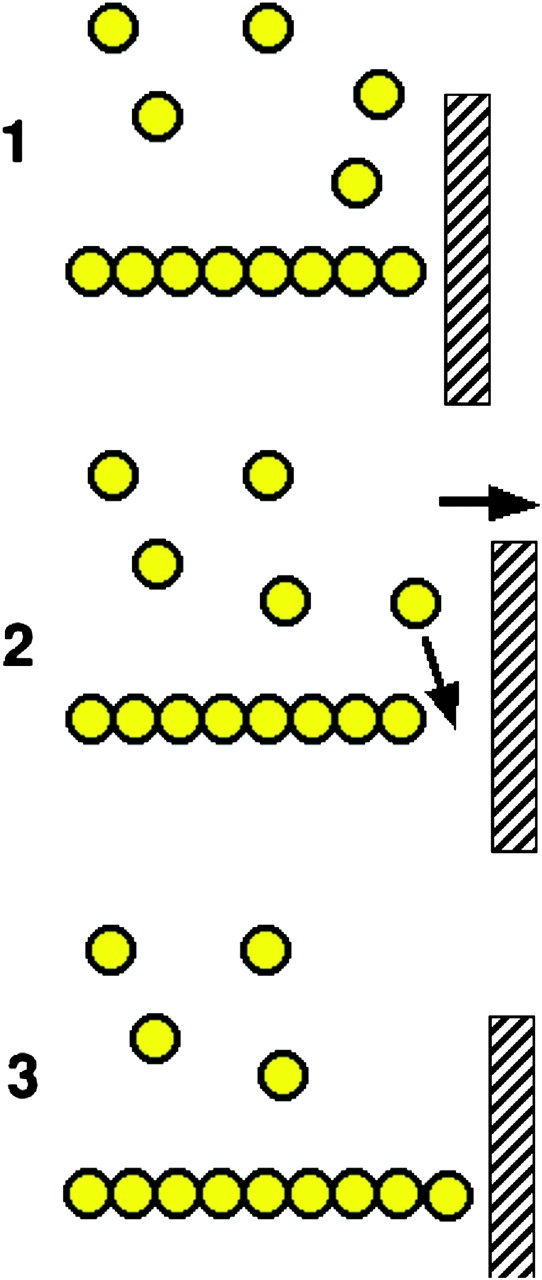
Figure 5.

A schematic of force production by actin polymerization. A single actin polymer is shown adjacent to a load, against which it is pushing. In the transition from State 1 to 2 the gap between the end of the filament and the load is increased by either a fluctuation in the position of the load, or in the position of the actin filament. This allows the insertion of an additional actin monomer, thus extending the filament, and leading to a new equilibrium position that has moved 2.7 nm to the right in State 3.
