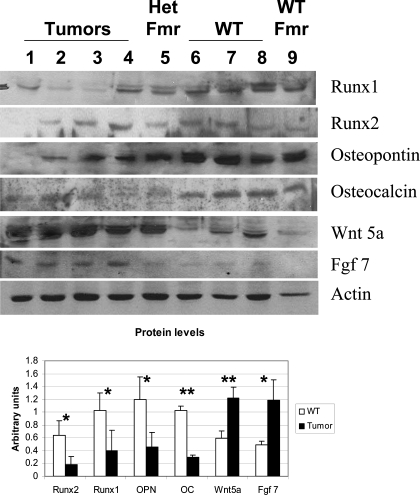
Figure 6.
Analysis of Selected Proteins by Western Blot
Proteins were prepared from the same samples as in Fig. 2 and Table 1 and Western blotted for the proteins indicated. Quantitation is shown below as in Fig. 2. Note that all tested proteins showed statistically significant changes, matching the results of mRNA expression analysis. *, P < 0.05; **, P < 0.01. This experiment was repeated five times, and a representative blot is shown.

