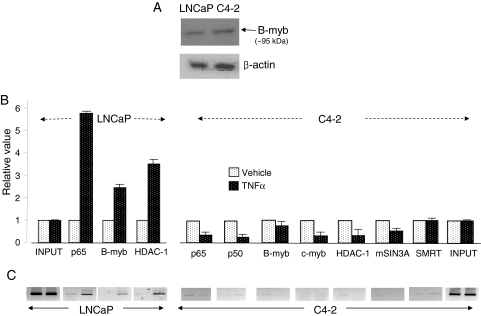
Figure 10.
B-myb Expression and TNFα-Induced Coregulator Dynamics at the Negative Regulatory Site in the AR Gene in LNCaP and C4-2 Cells
A, Western blot of B-myb, using β-actin as the normalization control. B, ChIP in LNCaP and C4-2 cells treated with TNFα (20 ng/ml for 30 min) or vehicle. Real-time qPCR quantified PCR signals. In each case, the value from vehicle-treated cells was set to unity. C, PCR products (285 bp) from the same ChIP analysis as in panel B, visualized as ethidium bromide-stained bands, on agarose gel.

