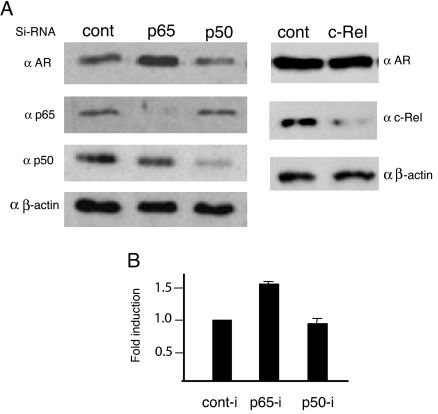
Figure 9.
Released Repression of Endogenous AR in p65 Knocked Down LNCaP Cells
A, Western blot of AR, p65 and p50 (left), and AR, c-Rel (right). B, Quantification of AR levels in the immunoblots using quanti-software. Bar graphs are averages ± sd from triplicate experiments. cont-i, Control RNA interference.

