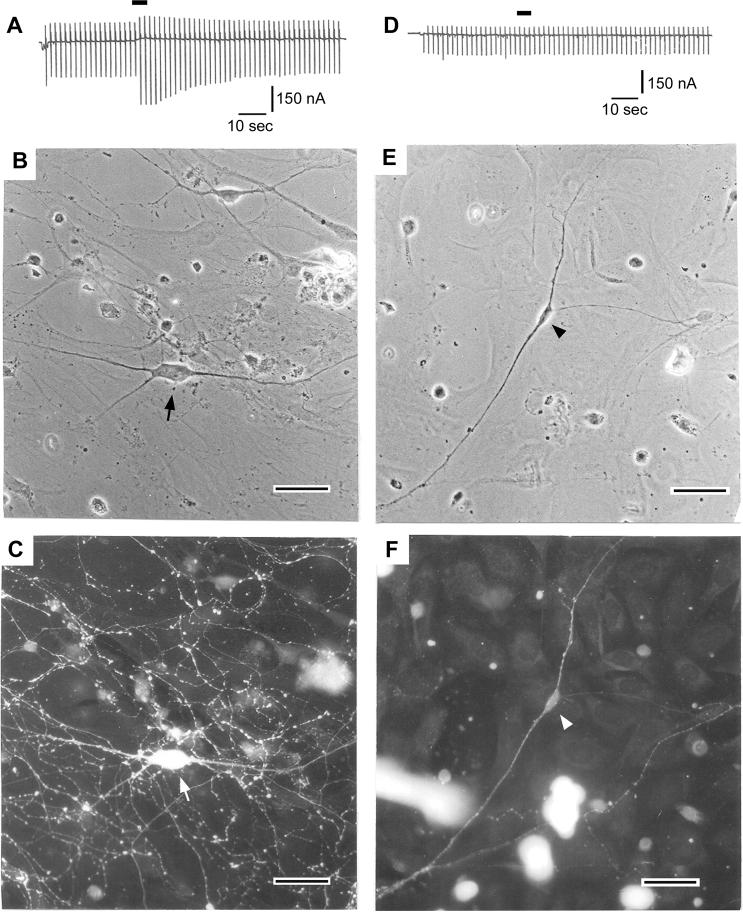
Fig. 2.
Correlation between the 8-OH-DPAT response and the serotonin immunoreactivity of cultured DR neurons. (A-C): A DR neuron, which responded to 8-OH-DPAT with a conductance increase, was a serotonergic neuron. (B): A phase-contrast micrograph of a neuron (marked by an arrow) after electrophysiological recording but before fixation, from a 7-day culture made from an 11-day-old rat. (C): The same neuron (pointed by arrow) after fixation showing positive reaction to serotonin-immunofluorescence stain. (D-F): An DR neuron, which did not respond to 8-OH-DPAT, was a non-serotonergic neuron. (E): A phase-contrast micrograph of a neuron (marked by an arrow head) after electrophysiological recording but before fixation from 11-day culture made from 12-day-old rat. (F): The same neuron after fixation showing negative reaction to serotonin-immunofluorescence stain. In A and D, conductance changes were monitored by applying a recurrent command pulse sequence consisting of a square-wave depolarization (20 mV, 50 msec) and hyperpolarization (30 mV, 50 msec). The application of 8-OH-DPAT (1 μM, 5 sec) was conducted by puff application and marked by horizontal bars. The holding potential was −77 mV and 5 mM K+ external solution was used.

