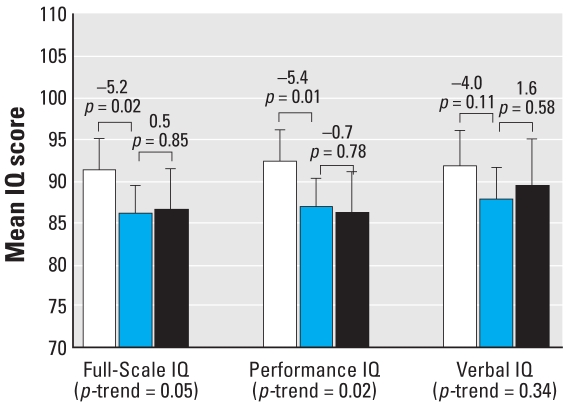
Figure 4.
Differences in Full-Scale, Performance, and Verbal IQ associated with increasing infancy average blood lead concentrations (n = 174). Mean IQ levels are adjusted for child’s sex, birth weight, and transferrin saturation; mother’s race, IQ, and education level; HOME-SF total score, family income, and maternal prenatal smoking. Error bars represent 95% confidence intervals. White bars represent the mean IQ of children with blood lead concentrations < 5 μg/dL (n = 62), the blue bars represent the mean IQ of children with blood lead concentrations 5–9.9 μg/dL (n = 79), and the black bars represent the mean IQ of children with blood lead concentrations ≥ 10 μg/dL (n = 33). Values above the brackets represent the mean difference in IQ for adjacent groups and associated p-values.

