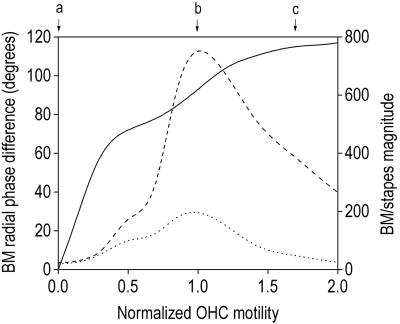
Figure 3.
Motion of the model BM at the position of the peak during sound stimulation to the stapes (30 kHz), as a function of OHC motility (normalized relative to the optimum value of 330 pN/nm). The solid line shows the phase difference between motion at the edge of the outer pillar cells and beneath row three of the OHCs. The magnitude of the motion at these two positions—relative to that of the stapes—is shown by the dotted and dashed lines, respectively. Letters at the top of graph indicate the motility values used for Fig. 2 a–c.

