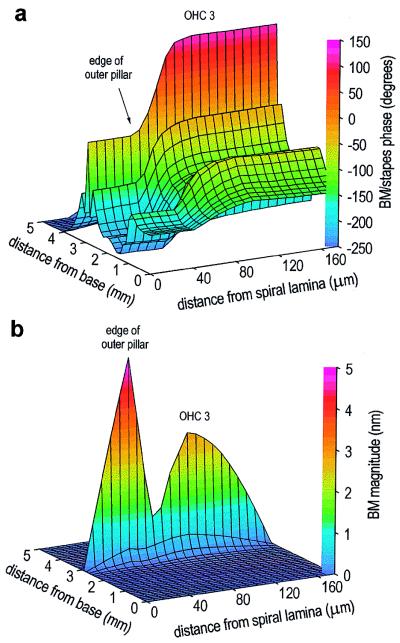
Figure 5.
Response of the model BM during localized stimulation (40 kHz, 50 pN) of motility in OHCs located 3.0 mm from the base (corresponding to the position of the motion peak during sound stimulation at 30 kHz; see Fig. 2b). Forward transduction in the OHCs throughout the model is switched on. (a) Phase. At the position of stimulation, the BM motions beneath the pillar cells and beneath the OHCs are in antiphase (i.e., a phase difference of 180°). (b) Magnitude. As during sound stimulation to the stapes, the pillar cells rotate as a rigid structural unit, but now the motion beneath the edge of the outer pillar cells is larger than at the center of BM, with a minimum occurring between these two regions.

