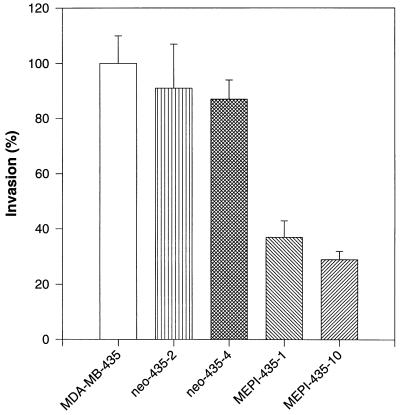
Figure 6.
Inhibition of cell invasion by MEPI. Comparison of invasion potentials of MEPI-positive and MEPI-negative cells. The invasion of MDA-MB-435 cells was used as control and was taken as 100%. The invasion potentials of all of the other clones were expressed as a percentage of the control. The numbers represent the mean ± SE of three cultures. Statistical comparisons for pooled MEPI-positive MEPI-435–1 and MEPI-435–10 clones relative to pooled MEPI negative MDA-MB-435, neo-435–2, and neo-435–4 clones indicated P < 0.001 for the invasion.

