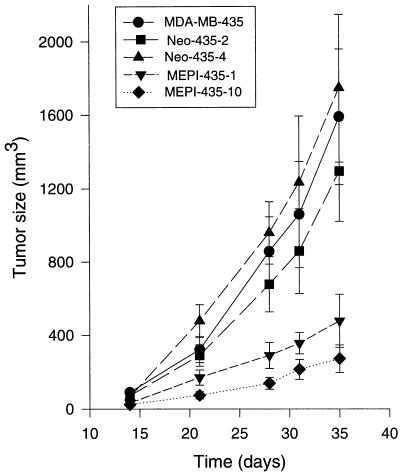
Figure 7.
In vivo tumor growth of MDA-MB-435, neo-435–2, neo-435–4, MEPI-435–1, and MEPI-435–10 cells in nude mice. Each of the eight mice in each group received two injections (one on each side) in the mammary fat pads between the first and second nipples. Tumor size was determined at intervals by three-dimensional measurements (mm) by using a caliper. Only measurable tumors were used to calculate the mean tumor volume for each clone at each time point. Each point represents the mean of tumors ± SE (bars).

