Figure 3.

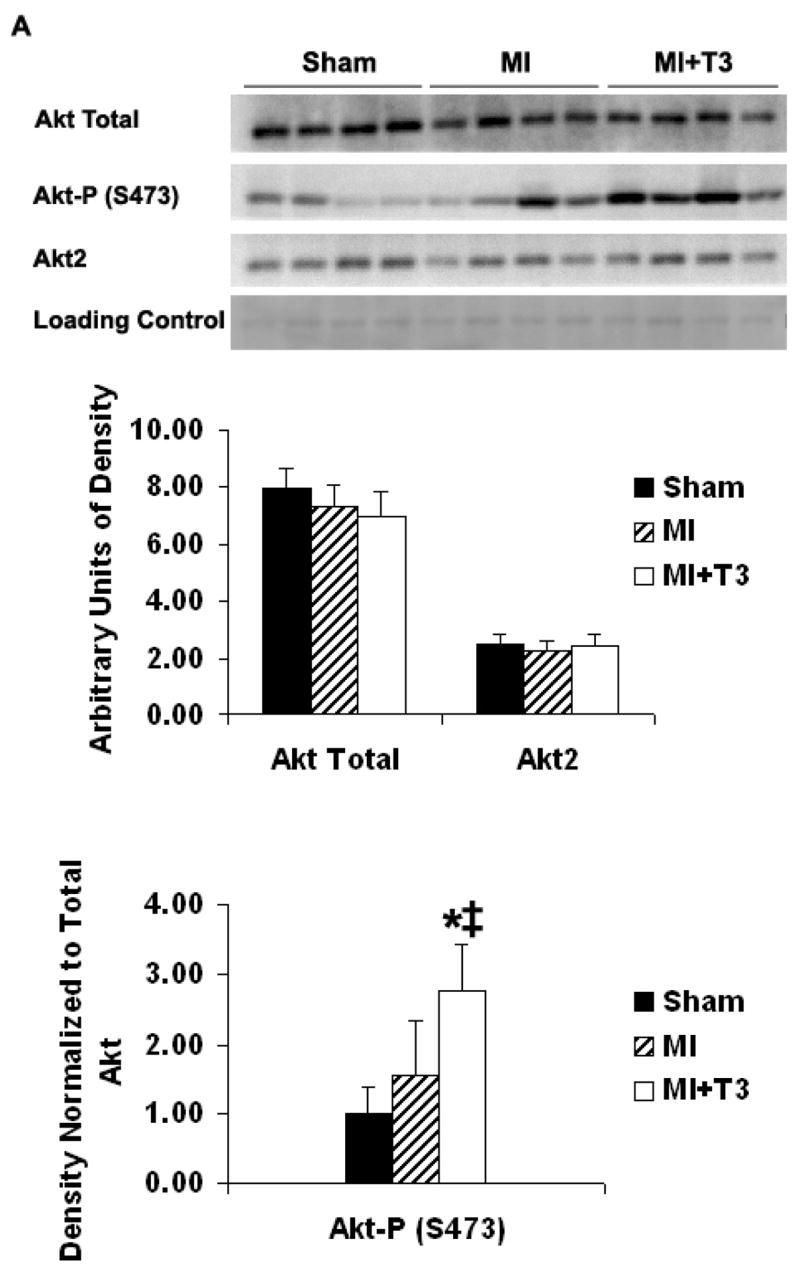
Figure 3A. Border area. Representative Western blot and densitometry for total Akt, phospho-Akt (S473) and Akt2 expressions. Results are mean (SD) with n=4 rats per group. *P ≤ 0.05 vs. MI group. ‡P ≤ 0.01 vs. Sham operated group; ANOVA with Student-Newman-Keuls’ Multiple Comparison Test.
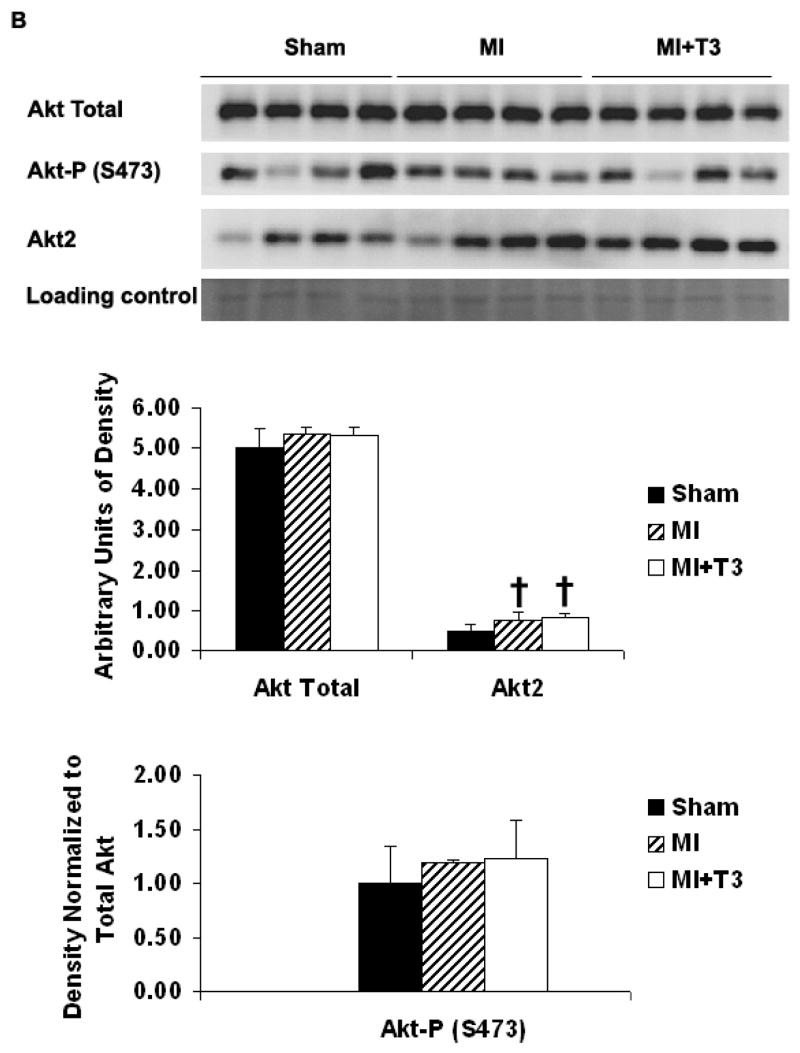
Figure 3B. Septal area. Representative Western blot and densitometry for total Akt, phospho-Akt (S473) and Akt2 expression. Results are mean (SD) with n=4 rats per group. †P ≤ 0.05 vs. Sham operated group; ANOVA with Student-Newman-Keuls’ Multiple Comparison Test.

