
Figure 2.
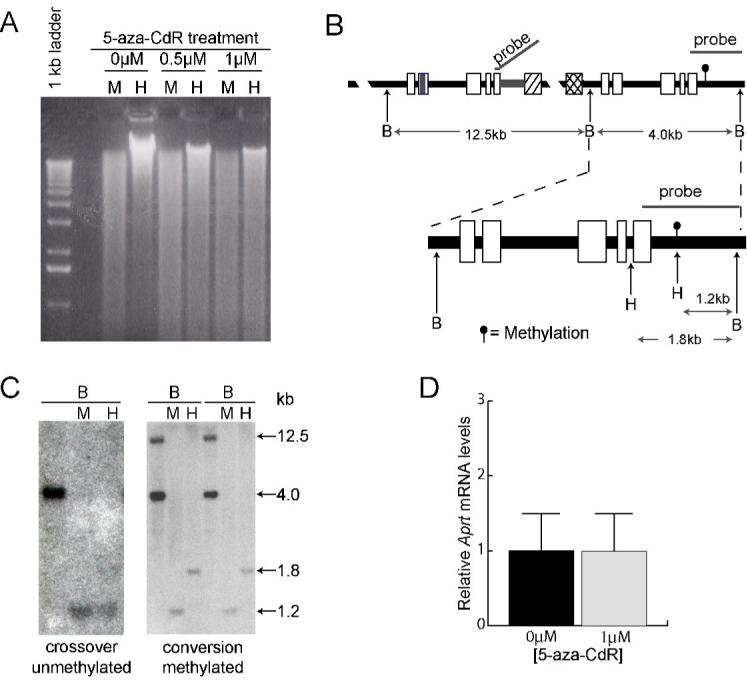
Methylation analysis of the Aprt locus. A. Analysis of global methylation in GSAA5 cells. Genomic DNA was isolated from untreated cells and from cells treated with 5-aza-CdR, digested with MspI (M) or its methyl-sensitive isoschizomer HpaII (H), and displayed by electrophoresis on an agarose gel. Decreased methylation in treated cells is shown by the more complete digestion of DNA by HpaII. A 1-kb marker ladder is shown on the left. B. Restriction maps and probe used for analysis of methylation at the Aprt locus. The complete recombination substrate is shown on top, with an expanded view of the 3′ copy of Aprt shown below. The methylated HpaII (H) site, which is indicated by the filled circle in the downstream copy of Aprt, is not present in the upstream copy. The probe hybridizes to the 12.5- and 4.0-kb BamHI (B) fragments, which contain the upstream and downstream copies of Aprt, respectively. C. Representative Southern blots showing the structure and methylation status of a crossover and two conversions. All samples were digested with BamHI (B) alone or in combination with MspI (M) or HpaII (H). Sizes of the digestion products (in kb) are shown on the right. D. Relative Aprt mRNA levels after 0 and 0.5μM 5-aza-CdR treatment are shown. Error bars represent one standard deviation.