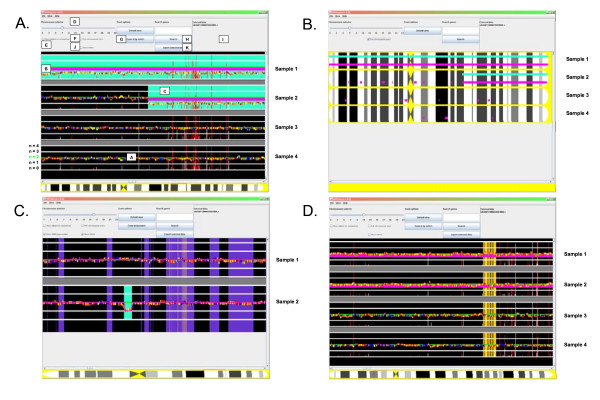
Figure 1.
SNPExpress Screenshot. A. DNA mapping array data from the Affymetrix 250 K NspI DNA mapping array was used to sequentially align the genotypes and copy numbers of chromosome 7 of four AML samples. The copy numbers (n = 0, 1, 2, 3, 4) are shown for each individual patient by horizontal lines. Copy number n = 2 is depicted by a green line (A). The SNP genotypes are sequentially aligned along the chromosome (AA: red; BB: yellow; AB: blue, noCall: white). LOH is indicated by a thick magenta horizontal bar (B), gains (default n > 2.5) by a pink (Figure 1C) and losses (default n < 1.5) by a turquoise background (C). Gene expression levels are visualized as vertical white bar at the chromosomal position of the gene-specific probe set. In the event that multiple probe sets span the same region in the chromosome-wide view the vertical gene expression bars are red and proportional to the highest expression value. The two upper samples clearly display a decreased copy number as was previously shown by cytogenetics, i.e., a complete monosomy (sample 1) or a deletion of the q-arm of chromosome 7 (sample 2). The overall expression of the majority of genes in the displayed region is decreased in the samples with chromosome 7 abnormalities. The chromosome selector (D; where 23 is the X chromosome), the mouse-over function showing info of each SNP or probe set (E), full chromosome view (F), zoom function (G) gene search function (H), the links to external databases (I), display CNVs (J) and export selected data (K) options are indicated. B. Full chromosome view of samples from 1A. C. CNV (purple background) and copy number of each SNP based on a HMM model (HMM copy number, magenta line) of the two AML patients from examples [33]. In the event that multiple CNVs span the same region in the chromosome-wide view the background is violet, whereas single CNV are indicated with a rosy brown background. D. UPD of chromosome 11 demonstrated using SNPExpress. Example of large scale UPD on chromosome 11 in the upper two AML patients with a normal karyotype in comparison to two other AML samples. The overall copy number is two and large regions of LOH are indicated by the thick magenta line across the chromosome. After using the search function, SNPs associated with WT1 are depicted with an orange background.

