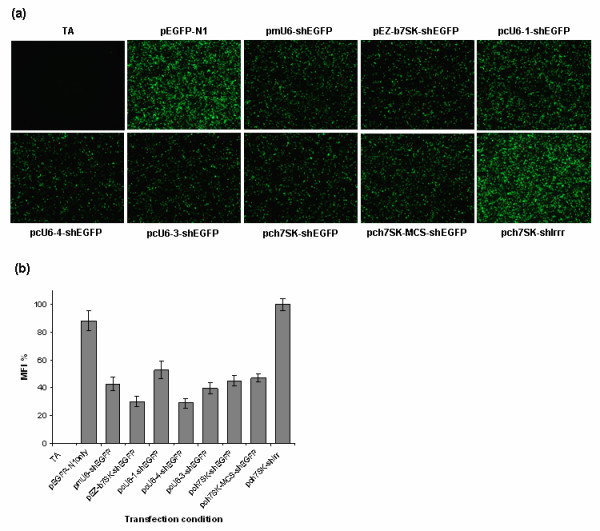
Figure 3.

EGFP knockdown conferred by chicken 7SK and U6 promoters in DF-1 cells. (a) Fluorescence microscopy images of DF-1 cells transfected with pEGFP-N1 only, or co-transfected with pEGFP-N1 and various shEGFP expression plasmids as indicated for each image. TA is transfection reagent-only control (no-plasmid DNA). Images presented are representative of results from three independent experiments at 60 hours post-transfection (Magnification 50×). (b) Flow cytometry results for EGFP knockdown assays in co-transfected DF-1 cells. shEGFP expression constructs co-transfected with pEGFP-N1 are indicated on the x axis. EGFP knockdown was measured as a percent mean fluorescence intensity (MFI %), normalised to the average MFI of the negative control pch7SK-shIrr cells (100%). Error bars represent the standard error of the mean (SEM) calculated from at three independent experiments. Where no bars or error bars are visible the MFI and or SEM is less than 1%.
