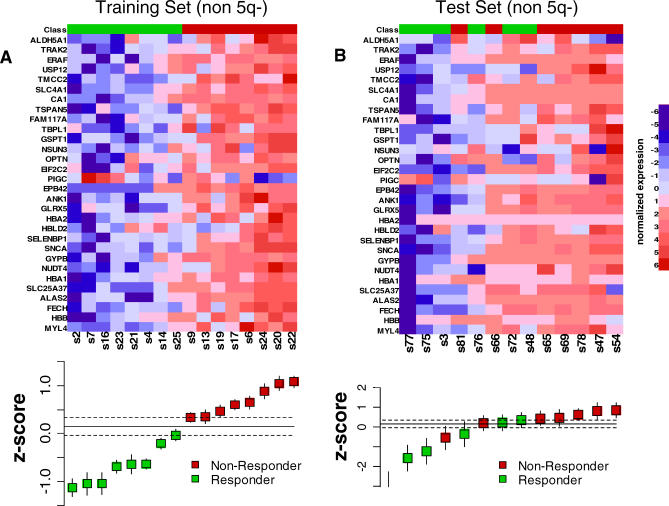
Figure 4. Prediction of Lenalidomide Response Using the Response Signature.
Each gene in the response signature was normalized to a reference signature and converted to a z-score. The heat maps depict the normalized expression of each gene in the response signature. High expression is shown in red, and low expression is shown in blue. The box-and-whisker plots below the heat maps depict the average z-scores for the response signature for each sample. The dotted lines indicate the zone in which no call can be made between responder and nonresponder. In the training set (A), all samples are correctly separated by the predictor. In the test set (B), lenalidomide response is correctly predicted nine out of 11 samples (82%), and no call could be made in two samples.

