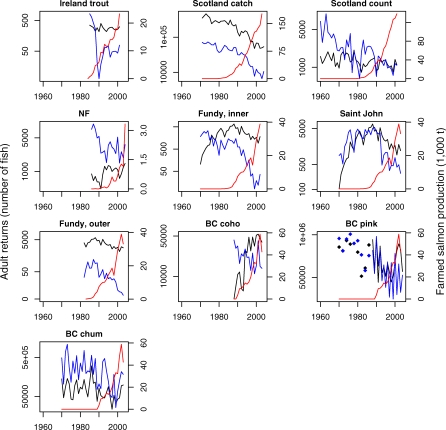
Figure 1. Adult Returns of Wild Salmonids in Control (Black) and Exposed (Blue) Stocks, with Aquaculture Production (Red).
For plotting only, the returns to controls and exposed stocks have been separately summarized by a multiplicative model (log(Returnsi ,y) = ai + dy + ei ,y ; variables are the same as in Equation 1). The mean returns across stocks for each year are shown. Note that left-hand axes are on a log scale. Only even year values are available for pink salmon prior to 1989. Irish salmon are not included because only marine survivals (not returns) are available.

