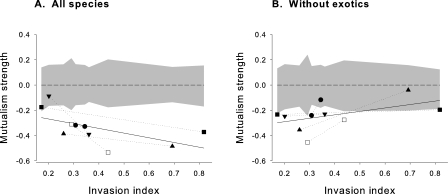
Figure 1. Relation of Mutualism Strength to Invasion Index for Ten Pollination Networks.
Mutualism strength was estimated by averaging the product of the mutual dependences over (A) all pairs of interacting species sampled in each web and (B) only pairs of interacting native species. The invasion index was the average proportion of the total interaction frequency represented by alien plants and alien pollinators. For each web, mutualism strength was standardized by the mean of the distribution of values generated by random re-distribution of observed interaction frequencies (see Materials and Methods). In each panel, symbols depict observations for the five pairs of webs analyzed (, Challhuaco; ▴, Cerro Otto; ▾, Llao-llao; •, Puerto Blest; □, Oceanic islands). Solid lines indicate the best linear fits (y = −0.18 – 0.42x, r 2= 0.427, F = 5.95, df = 1, 8, p = 0.041 for (A), and y = −0.34 + 0.27x, r 2= 0.250, F = 2.67, df = 1, 8, p = 0.14 for (B)). N = 10 pollination webs. Dotted line segments join points representing webs from paired disturbed and undisturbed areas in the south-Andean forest region or the two webs from oceanic islands. The gray zone is the region delimited by the 2.5 and 97.5 percentiles from the standardized random distributions.

