
Fig. 8.
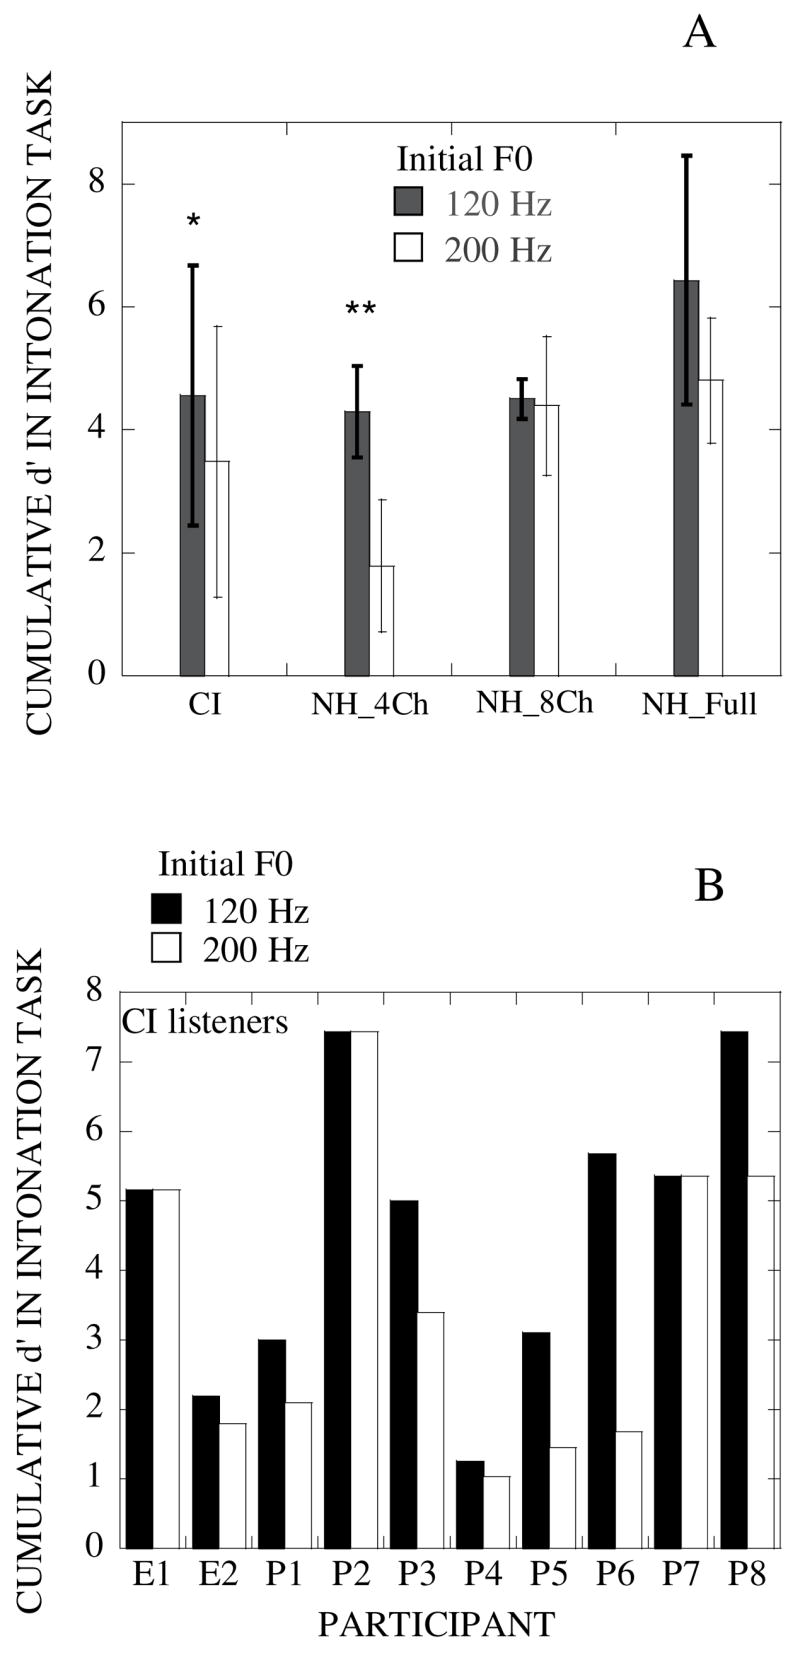
Fig. 8A. Barplot showing the cumulative d’ calculated from results with the 120-Hz and the 200-Hz initial-F0 stimuli. Results are shown for CI listeners, and NH listeners attending to 4-channel and 8-channel noiseband-vocoded speech (NH_4Ch and NH_8Ch) and unprocessed speech (NH_Full), respectively. Single asterisks indicate a significant difference between the two sets of results at the 0.05 level: double asterisks indicate significance at the 0.01 level.
Fig. 8B. Barplots showing cumulative d’ values obtained with the ten individual CI listeners for the 120-Hz and 200-Hz initial F0 stimuli (filled and patterned bars, respectively).