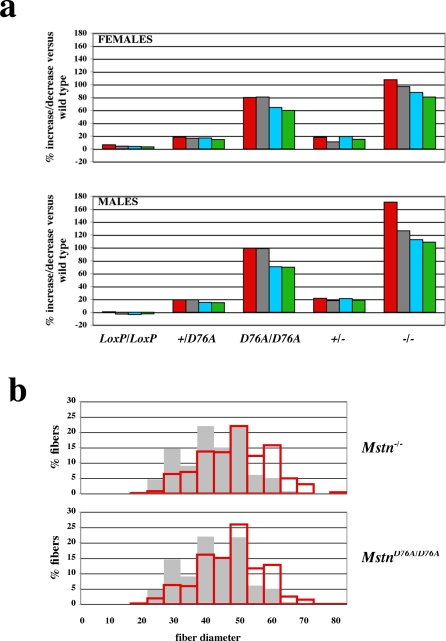
Figure 2. Analysis of muscles of mutant mice.
(a) Muscle weight increases in MstnD76A/D76A mice. Numbers represent percent increases relative to wild type mice and were calculated from the data shown in Table 1. Muscles analyzed were: pectoralis (red), triceps (gray), quadriceps (blue), and gastrocnemius (green). (b) Distribution of fiber diameters. Gray bars represent muscle fibers from wild type mice, and red bars represent muscle fibers from Mstn−/− and MstnD76A/D76A.

