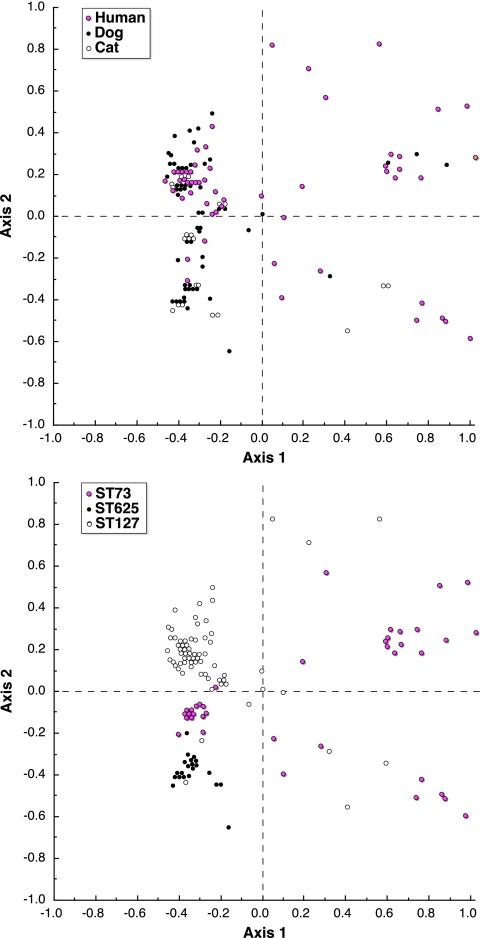
FIG. 3.
Distribution of 130 Escherichia coli serogroup O6 isolates from humans, dogs, and cats on the axis 1-axis 2 PCA plane. Data used were extended virulence genotypes (55 traits). Top and bottom plots contain identical data (one point per isolate), with points colored to indicate either host species (top) or ST (bottom). Axis 1 (positive values to the right and negative values to the left of the dashed vertical line) accounted for 43% of total variance. Axis 2 (positive values above and negative values below the dashed horizontal line) accounted for 22% of total variance. The axes are dimensionless, i.e., they have no units.

