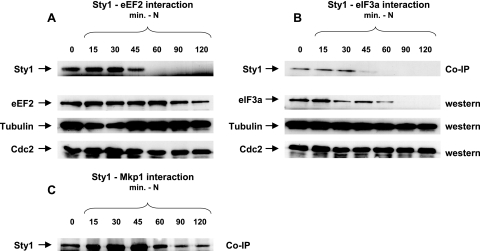
FIG. 3.
The intensities of the Sty1-eEF2, Sty1-eIF3a, and Sty1-Mkp1 interactions change after nitrogen deprivation. Strains expressing eEF2-HA and Sty1-myc (A), eIF3a-HA and Sty1-myc (B), or Mkp1-HA and Sty1-myc (C) were grown to an OD595 of ∼0.25 in YES medium. After a brief centrifugation, the cells were resuspended in EMM minimal medium without NH4Cl. Protein samples were prepared and loaded as for Fig. 1 at the times indicated after transfer to nitrogen-free medium. (A and B) Top rows, Sty1-myc coprecipitated with eEF2-HA (A) or eIF3a-HA (B). Second rows, Western blots from the same protein preparations as above, to show the total amount of eEF2-HA (A) or eIF3a-HA (B). Third and fourth rows, Western blots from the same protein preparations probed for α-tubulin and Cdc2 as loading controls. (C) Sty1-myc coprecipitated with Mkp1-HA.

