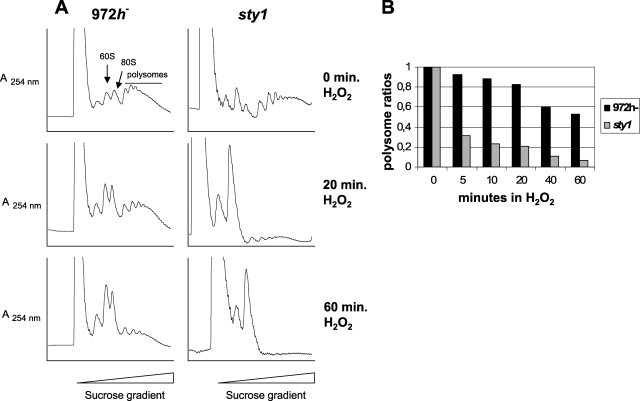
FIG. 5.
Polysomal contents of wild-type and sty1 cells after oxidative stress. 972h− and sty1 cells were grown to an OD595 of ∼0.5 and exposed to 1 mM H2O2. Polysomal extracts were prepared and analyzed as for Fig. 4. (A) Polysome profiles obtained at three different times after oxidative stress as for Fig. 4A. (B) Relative polysome ratios at five times after oxidative stress as for Fig. 4B.

