FIG. 5.
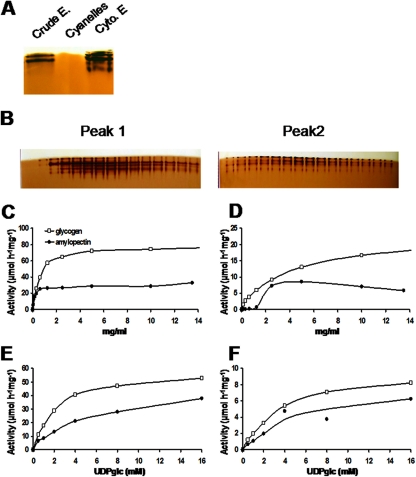
Characterization of starch synthase activities. (A) One hundred micrograms of total protein from crude extract (Crude E.), purified cyanelles, and cytosolic extracts (Cyto. E) was loaded on a native PAGE containing 0.15% glycogen. After migration, the gel was incubated with 1.2 mM UDP-glucose. Starch synthase activities were visualized as brownish bands after iodine staining only in the crude extract and the cytosolic extract. (B) Cytosolic proteins were further fractionated on an AEC column (MonoQ HR5/5) with a gradient of 1 M NaCl. Zymogram analyses performed on each fraction (10 μl) revealed the presence of two peaks of starch synthase activities. Fractions 15 to 29 (peak 1), which were very clearly separated from fractions 36 to 50 (peak 2), were subjected to an additional purification step by gel filtration chromatography in order to determine kinetic parameters (see Materials and Methods). Twenty microliters of purified starch synthases from peak 1 (specific activity, 61 μmol·h−1·mg−1 of protein) (C and E) and peak 2 (specific activity, 10 μmol·h−1·mg−1 of protein) (D and F) were incubated with 0, 0.08, 0.15, 0.31, 0.62, 1.25, 2.5, 5, 10, and 13.5 mg·ml−1 of amylopectin and glycogen in the presence of 16 mM UDP-Glc and 2 μM UDP-[U-14C]Glc (C and D) or were incubated with 0, 0.5, 1, 2, 4, 8, or 16 mM UDP-Glc and 2 μM UDP-[U-14C]Glc in the presence of 10 mg·ml−1 of amylopectin or glycogen (E and F). [U-14C]Glc incorporated onto polysaccharides was measured after the precipitation and washing steps. The results are expressed as micromoles of glucose incorporated per hour per milligram of protein. Purification factors were 41.5 and 8.1 for peaks 1 and 2, respectively.

