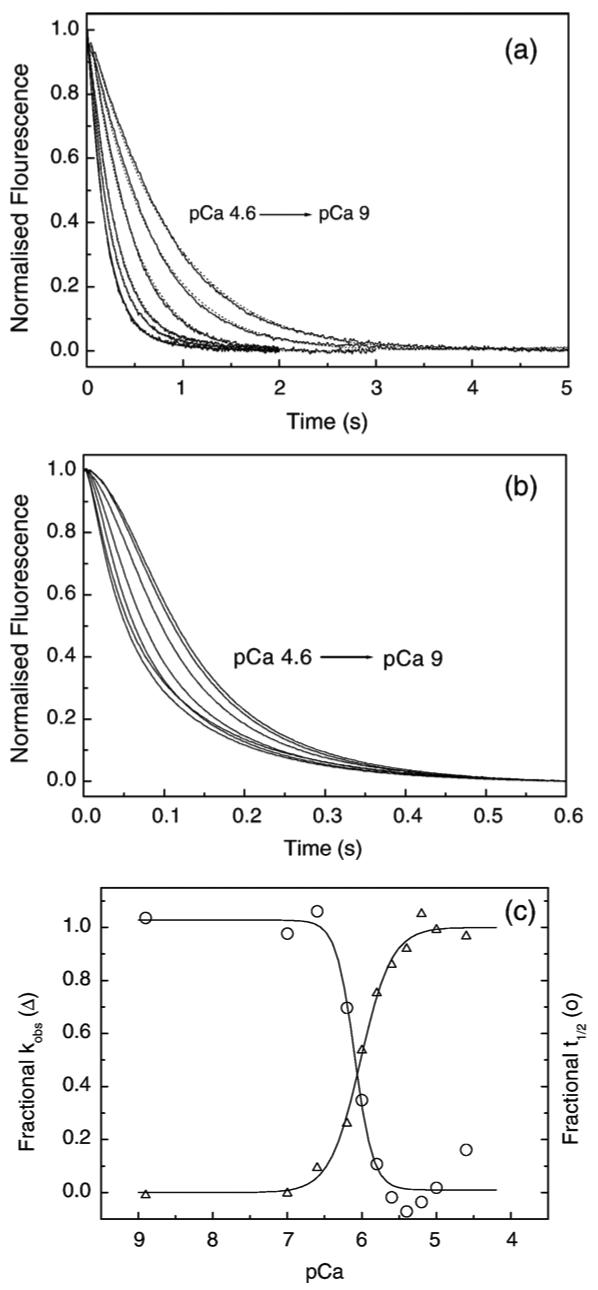
Figure 2.

Dependence of the rate of S1 binding to pyr-actin. TmTn on calcium concentrations. (a) Observed transients for excess pyr-actin (2.5 μM and 1 μM skTmTn) binding to 0.25 μM S1. The best fit single exponentials (dotted line) are superimposed and gave kobs values of: 5.2 s-1 (pCa 4.6), 4.25 s-1 (pCa 5.6), 3.4 s-1 (pCa 6), 2.2 s-1 (pCa 6.2), 1.55 s-1 (pCa 6.6) and 1.2 s-1 (pCa 9). (b) Observed transients for excess S1 (2.5 μM) binding to 0.25 μM pyr-actin and 0.15 μM skeletal muscle TmTn. The same pCa values as for (a) were used. No fitted line was used. (c) Plot of kobs for S1 binding to excess pyr-actin (Δ, left axis, from (a)) and the t1/2 values for excess S1 binding to pyr-actin transients (circles, right axis, from (b)) plotted as a function of pCa. The data were fitted to a Hill equation and gave pCa50% values 6.02±0.02 and 6.09±0.05 and Hill coefficients (nCa) of 1.5±0.07, 2.8±0.15 for kobs and t1/2, respectively. Experimental conditions were as for Figure 1.
