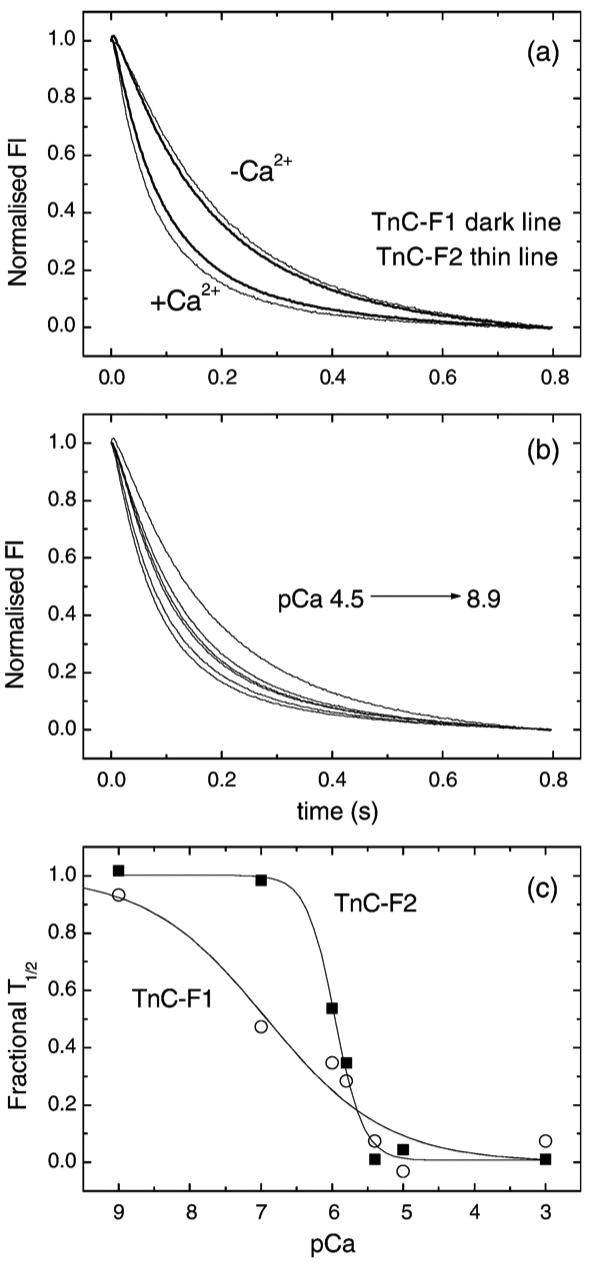
Figure 3.

The calcium dependence of excess S1 binding to Lethocerus TmTn regulated thin filaments. The effect of calcium on the observed fluorescence transient when 2.5 μM S1 was rapidly mixed with 0.25 μM actin that had been pre-incubated with 0.2 μM Lethocerus TmTn. (a) The transients observed in the presence and absence of Ca2+ for Lethocerus TmTn with TnC-F1 or TnC-F2. (b) The calcium dependence of the observed transients for TnC-F1 over the pCa range 8.9 to 4.5. (c) A plot of the t1/2 time point against pCa for the two Lethocerus TnCs. The best fit to the Hill equation gives pK50% of 6.92±0.63 and 5.96±0.03 with nCa of 0.51±0.33 and 2.17±0.50 for TnC-F1 and F2, respectively.
