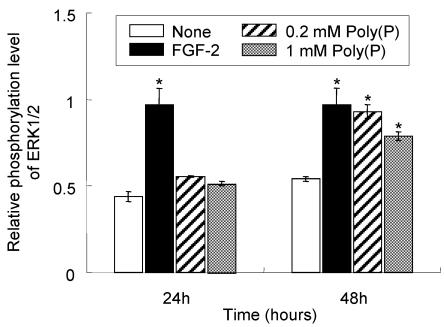
Fig 3.
Elevated phosphorylation level of ERK1/2 in HDPCs treated with poly(P). Phosphorylation levels of ERK1/2 after poly(P) treatment were estimated by ELISA. Relative phosphorylation levels of ERK1/2 were estimated by dividing the amount of phosphorylated ERK1/2 by the total amount of ERK1/2. Open bars, relative phosphorylation level of ERK1/2 in non-treated cells; closed bars, level in 10 ng/ml FGF-2-treated cells; shaded bars, level in 0.2 mM poly(P)-treated cells; gray bars, level in 1 mM poly(P)-treated cells. Each value is the average of three independent assays. Significant differences between the values of poly(P)-treated cells and the control cells (None) were determined by Student's t test. Asterisk (*), p <0.01 to control (none).

