Figure 6.

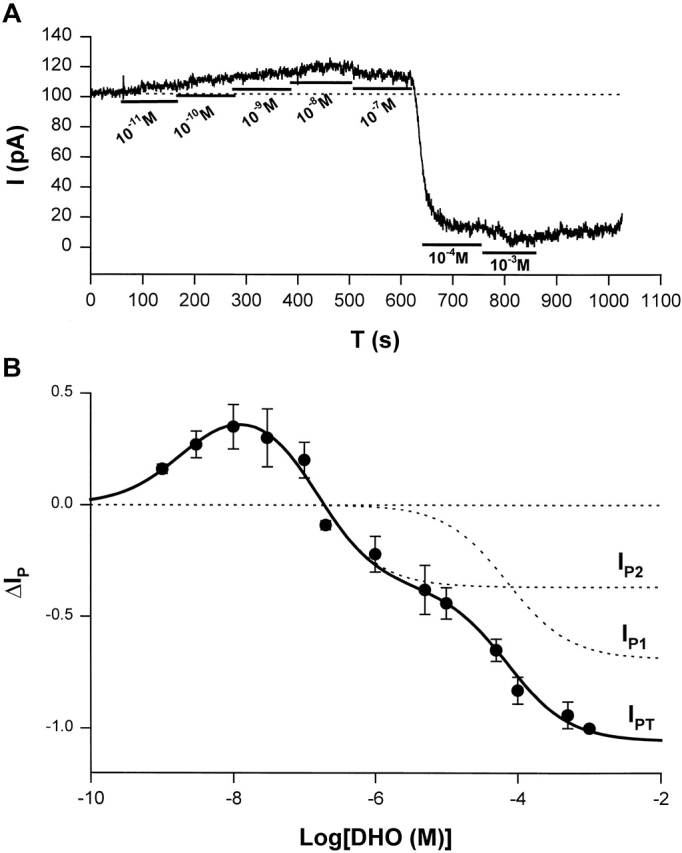
ΔIP-[DHO] relation in guinea pig ventricular myocytes. (A) An original record of holding current showing the protocol for observing stimulation of IP by low [DHO] and inhibition of IP by high [DHO]. In this cell, seven different concentrations of DHO from 10−11 to 10−3 were applied. The DHO-sensitive currents indicated the change in IP (ΔIP). (B) The ΔIP-[DHO] curve. The normalized ΔIP at each point was averaged from at least five cells, and the bars indicate SD (see results for normalization method). The points above the zero level (the dotted straight line) represent stimulation of IP, and the points below the zero level indicate IP inhibition. The maximal stimulation of IP was produced by 10 nM DHO. The smooth curves were obtained by curve fitting the points in the figure with Eq. 1. The solid smooth curve labeled by IPT was the total ΔIP, which is the sum of ΔIP contributed by the α2-isoform (IP2) and ΔIP contributed by α1-isoform (IP1). The positive values of ΔIP at DHO concentrations of 10−9, 3 × 10⁻⁹, 10−8, 3 × 10⁻⁸, and 10−7 M represent statistically significant increases in the holding current with P values of 6 × 10⁻⁹, 5 × 10⁻⁵, 10−7, 5 × 10⁻⁶, and 2 × 10⁻³, respectively.
