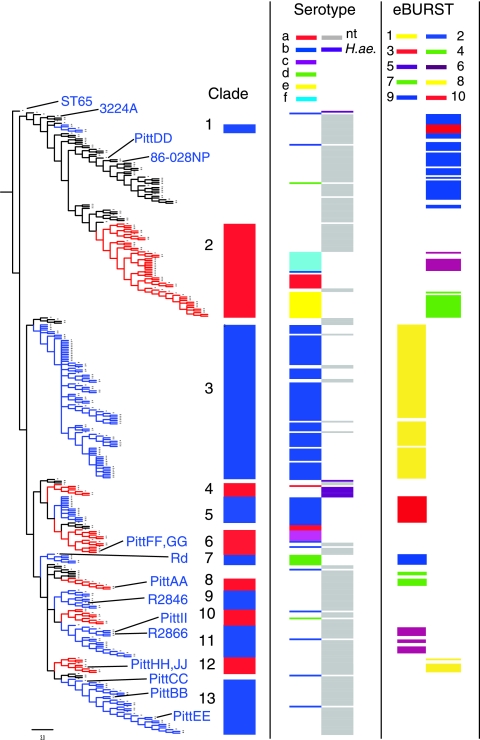
FIG. 1.
Maximum-parsimony majority-rule consensus tree for 359 ST, plotted with ST65 as the outgroup. Colored regions of the tree numbered 1 through 13 indicate branches (clades) that were found in 100% of trees, with the exception of clades 9 and 11, which were found in 92% and 81% of trees, respectively. The tree is aligned with a plot showing the serotype and the eBURST group for each ST. Each ST corresponded either to a single serotype or to one or more NTHI strains. H. influenzae biogroup aegyptius (H. ae.) strains are plotted separately from other NTHI strains. The ST for 15 sequenced strains are indicated on the tree. Table S1 in the supplemental material lists the position of each ST on the tree as well as its eBURST group and the serotype of associated strains.

